1. Adapting buildings: What are we concerned about?
People can experience different intensities of climate impacts as a result of the type of housing that they live in

Credit: © iStock/Daniel Berehulak
On this page:
Introduction
The impacts of climate change and extreme weather events can affect anyone, but those living in certain types of buildings have the potential for more serious harm. Not all residents of affected buildings are equally vulnerable; some individuals are affected by additional causes of vulnerability due to social or other environmental factors. People experiencing multiple causes of vulnerability are the most extremely socially vulnerable.
How buildings can increase exposure
There are a number of ways that buildings can be impacted by climate trends and weather events. Buildings also influence how climate and extreme weather events can affect their occupants (Table 1). Effects vary with different building types, different building constructions and in response to how buildings are used. Building users often exert a strong influence on how buildings respond to different environmental events and conditions.
The tendency of some buildings to increase the exposure of people to climate impacts can be compounded by other personal, environmental and social factors which make their residents particularly vulnerable. These include personal factors associated with sensitivity (e.g. due to age or poor health), factors associated with other environmental considerations (e.g. the availability of green space and shading) and social factors which affect how well people are able to adapt, including being on a low income, being socially isolated or being a tenant. See Who is Vulnerable? for more information about who is socially vulnerable and why.
The following sections particularly focus on how the characteristics of buildings and their use can increase people’s exposure to heat-waves and flooding and what measures can be put in place to respond. See Further Resources, Section 5 (above) for more information on the implications of events like heat-waves and flooding for particular vulnerable groups, such as older people, people in ill-health and people on low incomes and suggestions about the measures which can be taken in response.
|
Climate/ weather events |
Impact on the built environment and secondary impacts |
Possible Responses |
|---|---|---|
|
Floods
|
Internal and external building damage. Chance of slope instability. Increased insurance premiums in flood risk areas. |
Property level interventions - door guards; air bricks; temporary flood barriers, vigilant maintenance; air tightness; flood resistant materials such as steel skirting boards and solid flooring; damage minimisation through, removable/replaceable doors on fitted cupboards; relocation of electrical plugs and appliances. Neighbourhood level interventions - Sustainable Urban Drainage Systems (SUDS); community level flood defences; greenspace interventions and appropriate management regimes. |
|
Storms (including high winds) |
Greater chance of structural damage to buildings. Risk of rain penetration in exposed areas. |
Property level interventions - Reinforcement of the building structure, including roofs and increasing the capacity of guttering and drainage down-pipes. |
|
Cold events
|
Cold related stresses on buildings (e.g. freezing pipes, frost heave on stonework). Climate projections point to fewer events in the future and less energy needed for winter-time heating. |
Property level interventions - Vigilant maintenance; insulation. Installation of measures to further reduce energy demand and use (including use of energy efficiency measures). |
|
Heat waves (including temperature increases) |
Chance of soil shrinkage and subsidence, particularly in clay soil areas. Faster deterioration in concrete. Internal overheating of some buildings, particularly traditionally constructed high rise flats. |
Property level interventions - External solar shading (e.g. shutters); solar control window films; mechanical ventilation (air conditioning; fans); passive cooling measures (night time ventilation; wind ventilation; opening windows); enhance thermal mass in light weight constructions. Educate residents, including the residents and staff of care and residential homes and the users and managers of other buildings, about appropriate ventilation strategies and ensure there is awareness of heatwave advice, e.g. on appropriate behavioural changes in terms of food, drink and clothing. See Further Resources section on poor health, older people and the Heatwave Plan For England. Neighbourhood level interventions - Greenspace interventions for shade and cooling, appropriate greenspace management regimes (including drought management), protection of local open spaces. |
|
Drought (including reduced summer rainfall) |
Chance of soil shrinkage and subsidence, particularly in clay soil areas. Less water for building maintenance and residential use. |
Property level interventions - Rainwater harvesting, grey water recycling; measures to reduce household water demand and use (e.g. through installation of water efficiency measures) |
|
Milder winters |
Chance of spreading infections |
Property level interventions -Monitoring & maintenance; Air quality management systems; Ventilation |
|
Wetter winters |
Increased chance of damp in buildings. |
Property level interventions - Vigilant maintenance; rain screen cladding; ventilation |
|
Warmer summers |
Increased possibility of pests in buildings may cause damage, especially to historic structures. |
Property level interventions - Night ventilation for some pest problems Pest monitoring and control at property and community level. |
Table 1: Impacts of climate trends or weather events on the built environment and potential solutions1
Heatwaves and buildings
Cities are prone to the Urban Heat Island (UHI) effect, meaning that temperatures in cities are generally higher than in the rural areas which surround them2,3. The extent of these differences varies with weather conditions, season and time of day, often being most marked during the night-time and sometimes not been evident at all. During heatwave events, temperatures in city centres can be particularly high since the weather conditions associated with such events –e.g. low wind speeds and cloud-free conditions – also favour the development of the UHI effect. During the August 2003 heat-wave, a night-time UHI intensity of up to 9◦C was recorded in London4. During 2010, air temperature measurements showed that Manchester’s daytime UHI was most commonly around 1◦C in both summer and winter, increasing to 1.5◦C during summer nights5. Extreme UHI intensities of up to 8◦C were recorded during some summer nights with even greater values during winter nights6.
The UHI benefits urban residents in winter but can make people more likely to experience heat-related stress and discomfort in summer. Climate projections for the 2050s suggest that average summer night-time temperatures will be around 2-3◦C higher than today (based on the central estimate of the medium emissions scenario relative to 1961-90)7. This temperature increase will be felt most acutely in urban areas.
Heat-wave thresholds (Table 2) used to issue warnings and guidance to organisations and the wider public differ across the UK in recognition of the different temperatures which people are used to as a result of where they live in the country. However, they do not account for differences between urban and rural areas, except in London, by virtue of London having its own threshold value.
The internal temperature of a building is a product of three factors: the outside conditions; how a building is designed and constructed; and how a building is used (Figure 1), see Zero Carbon Hub. This means that it is not just the weather which affects temperatures inside someone’s home but also its basic characteristics, its situation and the behaviour of the residents living there. A person’s thermal comfort at any point in time is related to temperature, wind flow, humidity, clothing and activity levels. It can be affected by how much a person has the ability to modify their environment and the rate of change of conditions. See references 11, 12 and 13.
Figure 1: Illustration of the three main causes of overheating in buildings, see Zero Carbon Hub.
|
Region |
Day max (°C) |
Night min (°C) |
|
North East England |
28 |
15 |
|
North West England |
30 |
15 |
|
Yorkshire and the Humber |
29 |
15 |
|
West Midlands |
30 |
15 |
|
East Midlands |
30 |
15 |
|
East of England |
30 |
15 |
|
South East England |
31 |
16 |
|
London |
32 |
18 |
|
South West England |
30 |
15 |
|
Wales |
30 |
15 |
Table 2: Heat-wave thresholds used as part of the Heat-Health Watch system which runs from 1st June to 15th September each year. Temperatures must be forecast to exceed thresholds on at least 2 consecutive days to trigger warnings10
Buildings that are poorly designed, constructed or maintained may aggravate the effects of heat-waves on socially vulnerable12,13 residents. Some building types are more susceptible to overheating than others and may lack the means through which residents can easily cool down living spaces. Some of the same building stock may be inefficient in other ways, such as for retaining heat during the winter-time.
Flats in 1960s tower blocks are some of the most susceptible to overheating of all dwelling types due to their tendency to have poor insulation and rely on natural ventilation. A particular problem is the tendency to have windows which only open to one side of a building since this restricts the amount of air movement which can be achieved with natural ventilation14, see CREW retrofit tool. Problems are particularly acute when the orientation of the building means that sunlight can enter through windows for much of the day. Flats in high rise buildings can show a six-fold difference in temperature between the top and ground floors15. Another important reason for overheating is the lack of insulation that these flats tend to have. This allows heat to quickly enter buildings. Building standards have changed since the 1960s and issues associated with overheating are now included in relevant industry standards, such as Building for Life. However, some commentators point out that legislation still does not require developers to ensure that new flats incorporate through ventilation as part of their design, see news article.
Poor insulation means that there is less of a buffer between internal and external temperatures. Just as heat is let out quickly in colder periods so heat gain is larger during periods of high temperatures16.
The English Housing Survey Housing stock report17 estimates that in 2008 there were around 63,000 flats consisting entirely of attic rooms. Such flats need to have good insulation, coupled with appropriate shading and ventilation, to avoid overheating during extreme temperatures. Flats in the upper stories of blocks are also likely to be associated with higher temperatures; blocks of six or more storeys made up around 8% of the total stock of flats in England in 2008.
Problems of overheating in buildings are a particular concern where there are multiple reasons for vulnerability in their occupants. For example:
- People on low incomes living in accommodation requiring adaptation may not be able to afford the necessary adaptations to cool their homes in summer.
- People in accommodation maintained or managed by others may have limited capacity to make changes.
- Sensitive people may be living in accommodation which increases their exposure to high temperatures. Older people who live in multi-occupancy flats may be particularly vulnerable because of a tendency for the flats to overheat and because it may be more difficult for occupants to easily gain access to outdoor spaces which may be cooler18. In addition, restrictions on window openings in care homes or in high-rise flats can make it difficult for occupants to self-moderate temperatures during hot weather. See the Further Resources section for more information on the implications of hot weather for sensitive groups.
Personal, environmental and social factors also affect how residents live within their homes and how far they are able or willing to act on advice during heat-waves. Age, health and mobility may affect the ability of people to open windows in their homes without the help of carers, neighbours or other trusted members of the local community. Evidence from the Chicago heatwave of 1995 showed that fear of crime was a factor restricting the extent to which people were willing to sleep with open windows at night19. Environmental factors such as noise, air pollution and pests may also affect people’s willingness to leave windows open for extended periods and particularly at night when the benefits are most important.
Institutional regimes can restrict a person’s capacity to respond to hot weather. Given that different people have different tolerances to heat (and cold), group living and working presents a particular problem for maintaining comfortable temperatures for all. This can be an issue in care homes20 and other institutional spaces21. Studies of schools, for example, have shown that comfort levels among children vary greatly and this has an impact on their alertness in the classroom26.
Flooding and buildings
For those living in urban areas, increased surface sealing by buildings, roads, car parks and walkways reduces the ability of natural drainage systems to remove runoff created during intense rainfall events or as a result of flooding22.
There are many ways that water can enter buildings and damage their structure, services and contents (Figure 3), see the Six Step Resilience tool. Although there are technologies available to prevent or reduce the problem, average costs of £4,700 per property23 can be prohibitive, and unaffordable to those on low incomes24.
Some buildings are particularly susceptible to water incursion, for example basement dwellings. The English Housing Survey Housing stock report25 estimated that in 2008 around 2% of all homes in England (some 340,000 dwellings) had some of their rooms in basements. There were also around 84,000 flats which had basements and three-quarters of these had all of their living accommodation below ground level.
The difficulties in using available building level adaptations can be compounded by other sources of vulnerability, for example factors associated with:
- Awareness of problems and their solutions, including the ability to access and use available information
- Lack of control over buildings and their upkeep
- Age, mobility problems or ill-health which can affect an individual’s ability to obtain, fit and use measures.
Personal, environmental and social factors also affect how far residents can install and use property level adaptations to flooding. Age, health and mobility may strongly affect the ability of people to use flood gates or other flood protection measures without the help of carers, neighbours or trusted members of the local community. There is also evidence that people in some areas may be unwilling to take preventative measures while out of the home due to concerns that homes may look unoccupied and be targeted by burglars. Making adaptations to homes may also be resisted if home-owners feel that it would reduce the value of their homes or make it difficult to sell27.
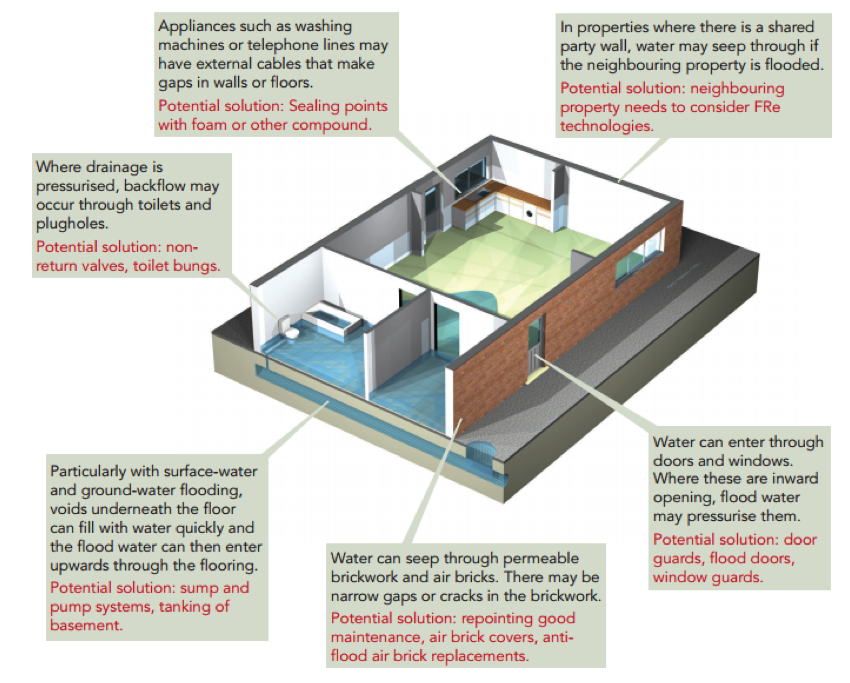
Figure 3: Routes for water entry into buildings and potential solutions28
References
- Adapted from Connelly, A. 2011. Adapting Office Buildings for Climate Change. Carter. J. G. and Lawson, N. 2011. Looking back and projecting forwards: Greater Manchester’s weather and climate. EcoCities, University of Manchester, RIBA . 2007. Climate Change Toolkits. Online Portal. Shaw, R. Colley, M. and Connell, R. 2007. Climate change: adaptation by design: a guide for sustainable communities. Town and Country Planning Association.
- R. L. Wilby. 2003. Past and projected trends in London’s urban heat island. Weather, 58(7), 2003.
- Greater London Authority (2006) London’s Urban Heat Island: A Summary for Decision Makers
- Capon, R. and Oakley, G. (2012) Climate Change Risk Assessment for the Built Environment Sector
- Cheung, Kei Wang (2011) An urban heat island study for building and urban design. PhD thesis, University of Manchester.
- Cheung, Kei Wang (2011) An urban heat island study for building and urban design. PhD thesis, University of Manchester.
- Capon, R. and Oakley, G. (2012) Climate Change Risk Assessment for the Built Environment Sector DCLG (2012) Investigation into Overheating in Homes: Literature Review
- Thermal comfort and Health and Safety Executive. What is Thermal Comfort?
- Nicol, J. F. and Humphreys, M. A. (2002) Adaptive thermal comfort and sustainable thermal standards for buildings, Energy and Buildings, 34: 6: 563-572,
- Met Office Heat Health Watch
- Benzie et al. 2011. Vulnerability to heat-waves and drought: adaptation to climate change. Joseph Rowntree Foundation, York.
- Aecom (2012) Investigation into overheating in homes: a literature review. Department for Communities and Local Government, London.
- DCLG (2012) Investigation into overheating in homes. Literature review.
- DCLG (2012) Investigation into overheating in homes. Literature review.
- DCLG (2010) English Housing Survey Housing stock report 2008
- Conditioning Demand: Older People, Diversity and Thermal Experience, Summary of the project and its outcomes.
- Klinenberg, E. (2002) Heatwave: A Social Autopsy of Disaster in Chicago. Chicago, IL: University of Chicago Press
- Wolf, J., Adger, W.N., Lorenzoni, I., Abrahamson, V. & Raine, R. (2010) “Social capital, individual responses to heat waves and climate change adaptation: An empirical study of two UK cities”, Global Environmental Change, 20(1), pp. 44–52
- DCLG (2012) Investigation into overheating in homes. Literature review.
- Houston, D., Werritty, A., Bassett, D., Geddes, A., Hoolachan, A. & McMillan, M. (2011) “Pluvial (rain-related) flooding in urban areas : the invisible hazard”, Joseph Rowntree Foundation, York
- JBA/Environment Agency (2012) Evaluation of the Defra Property-level Flood Protection Scheme: 25918
- Bichard, E. and Kazmierczak, A. 2012. Are homeowners willing to adapt to and mitigate the effects of climate change? Climatic Change 112: 633-654
- DCLG (2010) English Housing Survey Housing stock report 2008
- Douglas, I., Garvin, S., Lawson, N., Richards, J., Tippett, J. and White, I. (2010) ‘Urban pluvial flooding: A qualitative case study of cause, effect and nonstructural mitigation’. Journal of Flood Risk Management, 3(2), pp. 112–25
- White, I., O’Hare, P., Lawson, N., Garvin, S., and Connelly, A. 2013. Six steps to flood resilience – guidance for local authorities and professionals. Manchester. Adapted from CIRIA 2005
- Teli, D., Bourikas, L., James, P.A.B, Bahaj, A. S. (2017) Thermal Performance Evaluation of School Buildings using a Children-Based Adaptive Comfort Model. Procedia Environmental Sciences 38 ( 2017 ) 844 – 851
- Douglas, I., Garvin, S., Lawson, N., Richards, J., Tippett, J. and White, I. (2010) ‘Urban pluvial flooding: A qualitative case study of cause, effect and nonstructural mitigation’. Journal of Flood Risk Management, 3(2), pp. 112–25
-
White, I., O’Hare, P., Lawson, N., Garvin, S., and Connelly, A. 2013. Six steps to flood resilience – guidance for local authorities and professionals. Manchester. Adapted from CIRIA 2005

Built by:
![]()
© 2014 - Climate Just
Contact us