Introduction
User feedback Leeds Climate Just event, Jan 2014 © Climate UK
This user guidance illustrates how the Climate Just map tool can be used to understand socio-spatial vulnerability and climate disadvantage in your area, including the latest data release associated with the Neighbourhood Flood Vulnerability Index (NFVI) and Social Flood Risk Index (SRFI). It provides an introduction to the key concepts and examples of the maps and what they mean.
This information is also available as a downloadable document, User Guide to Map Tool 2017, as is the earlier version of the user guide explaining the original social vulnerability to flooding and flood disadvantage data, User Guide to Map Tool 2014.
On this page
Introduction
Climate disadvantage occurs when vulnerable people and places are exposed to climate hazards (Box 1). Climate change and extreme weather events may differentially impact people’s health and wellbeing across the UK, due to differing levels of vulnerability and exposure. The map tool illustrates where this can occur in your local area.
Maps are available illustrating:
- River and coastal flood disadvantage
- Surface water flood disadvantage
- Heat disadvantage.
|
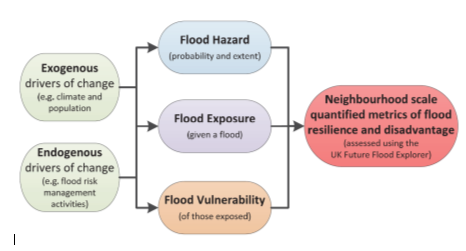
Box 1: Mapping climate disadvantage
The map tool contains social vulnerability maps which show places where the current characteristics of people and communities could result in negative impacts on their wellbeing from flooding or high temperatures. These maps are combined with others showing the potential to be exposed to flood hazards and high temperatures (in the present day and 2050s). Combined maps of flood disadvantage or heat disadvantage show how the likelihood of being affected compares with the potential for severe impacts on wellbeing in an area. The graphic below shows the basic structure for the 2017 version of the flood disadvantage data.
|
|
|
Structure of the maps
Flood-related data
There are two main measures contained in the Climate Just Map Tool. They are:
- the Neighbourhood Flood Vulnerability Index (NFVI)
- the Social Flood Risk Index (SFRI)
Social flood risk maps are provided for two flood themes:
- pluvial (surface water) flooding
- coastal and fluvial flooding combined
Social flood risk maps cover three different scenarios:
- Present day
- 2050s 2 degrees rise in Global Mean Temperature (GMT) (from the 1961-90 baseline as used in the latest UK climate change projections (UKCP09)
- 2050s 4 degrees rise in GMT assuming a continuation in current levels of adaptation and high population growth.
Social flood risk is given as two different measures for each neighbourhood:
- Neighbourhood scale - a 'group' measure taking account of the number of people living within the floodplain and the overall social vulnerability of the neighbourhood.
- Individual scale - an 'average' measure representing 'per person' risk.
The Neighbourhood Flood Vulnerability Index (NFVI) maps are structured into five characteristics, each of which has a separate map:
- Susceptibility
- Ability to prepare
- Ability to respond
- Ability to recover
- Community support
Maps are also provided for 12 indicator indices and 27 supporting variables which underpin the NFVI (Figure 1)
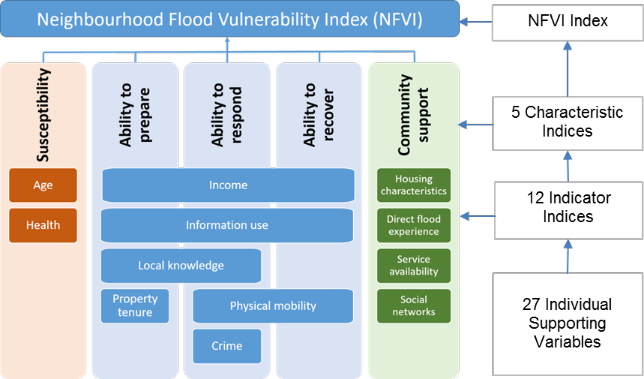
Figure 1: The structure of social vulnerability according to the new Neighbourhood Flood Vulnerability Index (NFVI).
Heat-related data
The structure of the maps is illustrated in Figure 2. For each theme (e.g. mean summer temperature maxima) there are three main maps:
- Disadvantage (how socio-spatial vulnerability and hazard exposure come together)
- Socio-spatial heat vulnerability
- Hazard-exposure.
Disadvantage is shown as an average per 25km cell and as a population weighted metric per 25km cell. The heat disadvantage themes are:
- mean summer maximum temperature in the 2050s
- change in mean summer maximum temperature from the climate baseline to the 2050s
- change in temperature of the warmest day from the climate baseline to the 2050s
- change in temperature of the warmest night from the climate baseline to the 2050s.
The socio-spatial heat vulnerability maps are structured into five dimensions, each of which has a separate map:
- Sensitivity
- Enhanced exposure
- Ability to prepare
- Ability to respond
- Ability to recover.
Finally, each of the separate indicators used to generate each dimension map have themselves been mapped. Additional information on the calculations behind the map is summarised in Box 2 and in the Technical User Guide.
Figure 2: Climate disadvantage as a measure of socio-spatial vulnerability and hazard-exposure. Bold denotes data available in the map tool
Components of the vulnerability data
Neighbourhood Flood Vulnerability Index
A variety of personal, environmental and social factors underpin the social vulnerability of people and places. These are grouped into 5 characteristics, which are themselves generated from 12 compound indicators and their 27 supporting variables. Interpreting the maps requires an appreciation of what has been included and why. It is also necessary to understand the limitations of the mapping work.
A list of the types of vulnerability data in relation to flooding included in the work is available in Table 1. You can view all the flood-related indicators in the map tool or download a full list New Flooding Indicators 2018
Table 1: Vulnerability metrics used to measure social flood vulnerability.
|
Metric |
Insight provided |
|
Vulnerability metrics |
|
|
Neighbourhood Flood Vulnerability Index (NFVI) |
The propensity of those living in a neighbourhood to suffer a loss of well-being should a flood occur. |
|
Susceptibility Index |
A characteristic of the NFVI reflecting the predisposition of an individual to experience a loss of well-being when exposed to a flood. |
|
Ability to Prepare Index |
A characteristic of the NFVI reflecting the actions taken by an individual during normal conditions (i.e. in the absence of a forecast or actual flood) that are likely to reduce the harm they suffer when a future flood occurs. |
|
Ability to Respond Index |
A characteristic of the NFVI reflecting the underlying reasons why some individuals act more effectively in the run up to and during a flood. |
|
Ability to Recover Index |
A characteristic of the NFVI reflecting the degree to which an individual can aid their own recovery. |
|
Community support Index |
A characteristic of the NFVI reflecting how the availability and quality of services provided by health and emergency services as well as broader care and social services influence the severity of harm caused by a flood. |
|
Indicator Indices |
12 composite indicators contributing to the characteristics of the NFVI (age; health; income; information use; local knowledge; property tenure; physical mobility; crime; housing characteristics; direct flood experience; service availability; social networks. |
|
Supporting Variable layers |
27 composite indicators which contribute to the indicator layers (see section 4) |
Socio-spatial vulnerability to heat data
A variety of personal, environmental and social factors underpin the social vulnerability of people and places. These are grouped into domains. Interpreting the maps requires an appreciation of what has been included and why. It is also necessary to understand the limitations of the mapping work. A list of the types of vulnerability factors included in the work (grouped into vulnerability domains) is available in Table 2 (in relation to heat). You can view the full list of all indicators on the Map tool Maps menu or in the document Indicators used in Map Tool.
Table 2: Domains associated with heat socio-spatial vulnerability
|
Dimension |
Domain |
Explanation |
|
Sensitivity |
Age |
The old and young are more physically susceptible to harm |
|
Health |
Those with pre-existing illnesses are more susceptible to harm |
|
|
Enhanced exposure |
Physical environment |
Amount of built up/non-built up areas |
|
Housing characteristics |
Types of buildings (e.g. basement dwellings) |
|
|
Ability to Prepare |
Income |
e.g. ability to obtain property-level solutions |
|
Tenure |
e.g. ability to modify living environment |
|
|
Information use |
e.g. ability to access and use information |
|
|
Local knowledge |
Extent of personal or community experience as a result of past events in the local area |
|
|
Insurance |
e.g. potential availability/affordability |
|
|
Ability to Respond |
Income |
e.g. ability to use property level (and other) solutions |
|
Information use |
e.g. ability to respond to warnings |
|
|
Local knowledge |
Extent of personal or community experience as a result of past events in the local area |
|
|
Insurance |
e.g. potential availability/affordability |
|
|
Social networks |
Personal and community networks |
|
|
Mobility |
e.g. general personal and household mobility |
|
|
Crime |
e.g. ability to deploy property level solutions |
|
|
General accessibility |
Extent of relative physical isolation |
|
|
Ability to Recover |
Income |
e.g. ability to obtain property level solutions |
|
Information use |
e.g. ability to access and use information |
|
|
Insurance |
e.g. ability to claim and re-insure |
|
|
Social networks |
Personal and community networks |
|
|
Mobility |
e.g. general personal and household mobility |
|
|
Housing mobility |
Neighbourhood level mobility, potential for recovery/decline |

Built by:
![]()
© 2014 - Climate Just
Contact us