What are we concerned about?
Some low income households are subject to a triple injustice
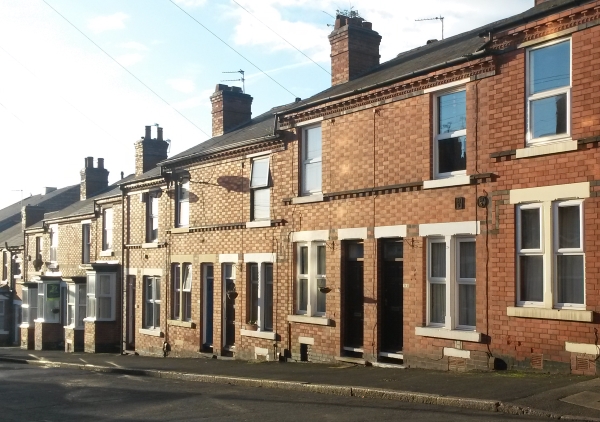
Victorian terraced housing © Climate UK
On this page:
- While they only make a relatively small contribution to carbon emissions, some low income households are subject to a triple injustice: they pay disproportionately for the policies to mitigate carbon emissions, and benefit less from those policies than higher income households. A number of carbon mitigation policies are funded through energy bills, and energy costs take a larger proportion of low income households’ income, relative to higher income households. Fuel poverty policy is closely linked to carbon mitigation policy, as both objectives are served by improved home energy efficiency, and in recent years fuel poverty policy has also been partly funded through energy bills. The low income households that do not receive energy efficiency or heating measures from fuel poverty policy are therefore paying for the policy while not receiving any benefit.
- As well as low income households generally, there is a wider set of disadvantaged groups that can be described as ‘energy vulnerable’, who may struggle to pay their energy bills, potentially due to high energy needs as well as poverty. Poverty can be defined as a lack of sufficient resources to meet minimum material and social needs1. For example, housebound elderly or disabled people require more energy at home than working couples with no children because they spend much more time at home and require a higher living temperature to remain healthy, and they may also need medical equipment which uses electricity. Ofgem’s Consumer Vulnerability Strategy defines vulnerability as the situation where a consumer’s personal circumstances and characteristics combine with aspects of the market to create situations where he or she is: significantly less able than a typical consumer to protect or represent his or her interests in the energy market; and/or significantly more likely than a typical consumer to suffer detriment, or that detriment is likely to be more substantial2. Here were have labelled this energy vulnerability. Energy vulnerability may encompass a wider set of households than those in fuel poverty (Box 1.1). See also Who is affected by fuel poverty?)
Box 1.1: Energy vulnerability
Energy vulnerability can be defined as a situation where a household has high energy needs relative to its ability to pay for energy.
High energy needs could be caused by the following factors:
Ability to pay for energy could be influenced by the following factors:
(Most of these factors are from Ofgem’s Consumer Vulnerability Strategy, pp15-16) |
- It is important to reduce carbon emissions from energy use in the housing stock as part of efforts to avoid dangerous climate change; however, funding some of these policies through household energy bills is problematic for low income households3. Policies include measures to improve the thermal efficiency of dwellings (e.g. the Energy Company Obligation and the Green Deal) and to promote low carbon generation (e.g. the Feed-In Tariff, the Renewable Heat Incentive). Some policies are funded through energy bills (e.g. the Energy Company Obligation, the Feed-In Tariff), some are funded through taxation (e.g. the Renewable Heat Incentive), and the Green Deal is a loan or pay as you save scheme. Some policies are specifically targeted at low income households, for example the Warm Home Discount, while others have different objectives, such as funding infrastructure change (see box 1.2 for more information).
Box 1.2: Carbon reduction and fuel poverty policies in Britain, purpose and funding sources
|
Policy, purpose, duration |
Nation |
Timescale |
Fuel type subject to costs |
Funding source |
Funding (note different timescales) |
|
ECO Carbon Emissions Reduction Obligation (CERO) Provides carbon reduction measures to households |
GB |
2013-2017 (from 2017 ECO will be replaced with a new domestic energy efficiency supplier obligation which will run until 2022)
|
Electricity & gas |
Energy bills |
Estimated at £1.3 billion per year in Government impact assessment. Scheme cost £1.4 billion in 2013, £1 billion in 2014 and £0.3 billion in 2015. Phase three of the scheme from April 2017 is expected to cost £640 million per year, rising with inflation. |
|
ECO Home Heating Cost Reduction Obligation (HHCRO) Provides heating cost reduction measures to households |
GB |
Electricity & gas |
|||
|
ECO Carbon Saving Communities Obligation (CSCO) Provides carbon reduction measures to lowest income 15% of LSOAs |
GB |
Electricity & gas |
|||
|
Encourages support for larger scale low carbon technology |
GB |
Round 1 - 2015 Round 2 - 2016 |
Electricity |
|
Round 1 2.1GW of capacity has been procured at a cost of £3.15 billion. |
|
Feed-In Tariff Supports small scale renewable electricity |
GB |
Ongoing (new tariffs introduced 2016 and mapped to continue to 2018/19 when measures will be either revisited or removed completely) |
Electricity |
Energy bills |
|
|
Warm Home Discount Direct and indirect support to fuel poor customers, including fuel bill rebate |
GB |
Current scheme 2015/16 Will continue to 2020/2021 |
Electricity & gas |
££320 million in 2015/6 £320 million up to 2020/21 rising with inflation
|
|
|
Smart meters Installation of smart meters in all homes and businesses |
GB |
To 2020 |
Electricity & gas |
Energy bills, but net benefit expected |
Net benefit of £6.2 billion expected over the period to 2030. Year by year balance of costs and benefits unknown. |
|
Domestic Renewable Heat Incentive Supports installation of renewable heat technology in households |
GB |
Ongoing |
n/a |
Taxation |
Spending on the RHI is expected to rise from £430m in 2015/16 to £1.15bn in 2020/21 |
|
Green Deal Supports installation of energy efficiency measures and low carbon heating. Previously, the Green Deal Finance Company provided finance to Green Deal providers to enable them to give out Green Deal loans. |
GB, (and Northern Ireland has its own Green Deal) |
In July 2015, the Green Deal finance company ceased to offer new loans. Any loans which have already been issued are not affected (although the Green Deal Finance Company have announced they are considering selling off their loan book) The Green Deal Assessment framework is still open and it is still possible to get a Green Deal loan from a private company. |
n/a (although for the individual household with a Green Deal loan pays via the electricity meter) |
Households receiving measures pay for them using a loan. |
n/a - funded by households receiving measures |
|
Green Deal Home Improvement Fund Discount on Green Deal measures |
GB |
Funding through the Green Deal Home Improvement Fund ceased in September 2015. Existing applications and vouchers will not be affected. Those customers who already have a voucher must redeem it before its expiry date. |
n/a |
Taxation |
£70 million of funding given out in third release of funding in March 2015 |
|
Green Deal Communities Funding for a few local authorities to support area-based delivery of Green Deal plans and ECO |
GB |
No further schemes receiving funding. In communities where funding is already allocated measures are still being installed. Householders had until March 2016 to place an order with a Green Deal installer and works finished by 30th June 2016. |
n/a |
Taxation |
|
|
Welsh Government Warm Homes NEST Energy efficiency improvements for homes with low energy efficiency rating |
Wales |
Ongoing (annual funding could vary) |
n/a |
Welsh government |
|
|
|
Also leverages other funding such as ECO (£1.3 million in 214-2015) |
|
|||
|
Welsh Government Warm Homes Arbed Energy efficiency improvements for homes |
Wales |
Phase 2 from May 2012 and ongoing |
n/a |
European Regional Development Fund |
|
|
Welsh government |
£12m over 3.5 years |
||||
|
Also leverages ECO money |
|
||||
|
Home Energy Efficiency Programmes for Scotland: Area Based Schemes Funding to local authorities to support area-based delivery of energy efficiency improvements |
Scotland |
Ongoing: likely to be at least until the end of ECO (annual funding could vary) |
n/a |
Scottish government |
|
|
Also leverages ECO money |
Target of levering £120m a year. |
||||
|
Home Energy Efficiency Programmes for Scotland: Warmer Homes Scotland Funding for energy efficiency measures for home owners or tenants of private landlords who have lived in their home for at least 6 months, and who are on a low income. |
Scotland |
Launched in 2015 (replacing the Energy Assistance Scheme). To continue for up to 7 years. |
n/a |
Scottish government
|
|
|
Winter Fuel Payment Annual payment to all people of pensionable age. Not means tested, and therefore a poorly targeted way of trying to address fuel poverty. |
GB (and Northern Ireland administers its own version). Those living abroad can still claim (although from autumn 2015 a temperature test is applied so those resident in warm countries do not receive the payment) |
Ongoing |
n/a |
Taxation |
£2.1 billion in winter 2014/15, plus £24.52 million payments to people living outside of the UK |
|
Cold Weather Payment Made to those in receipt of certain benefits at times of very cold weather |
GB |
Ongoing |
n/a |
Taxation, from Social Fund |
|
|
EU Emissions Trading Scheme and Carbon Price Floor Carbon taxes on fuel use(affects electricity generation) |
EU / GB |
Until at least 2020 |
Electricity |
Paid by generators of electricity and so electricity price is affected. |
£6.867 million in 2020 (cost to domestic consumers, estimated by modelling), less before 2020. |
- Other policies which have costs to domestic consumers which are not detailed here are nuclear decommissioning and Electricity Market Reform, which among other things will phase out the Renewables Obligation.
- Information in this table shows most recent data available at February 2015.
- There is an unequal distribution of responsibility for emissions, with affluent households in Britain being responsible for a higher proportion of total emissions related to housing and transport than lower income households. Figure 1.1 shows all direct household emissions by income decile and illustrates that the current distribution of household emissions is strongly correlated with household income ie higher income households are responsible for more emissions. Figure 1.2shows the proportion of each source’s emissions and responsibility for these emissions by income decile. For household fuels (covering both heat and power in the home), the richest income decile is responsible for twice as much carbon dioxide as the poorest income decile, and for all emissions categories considered together (household fuels and all types of transport) the richest decile is responsible for 16% of total emissions, more than three times as much as the poorest decile at 5%.
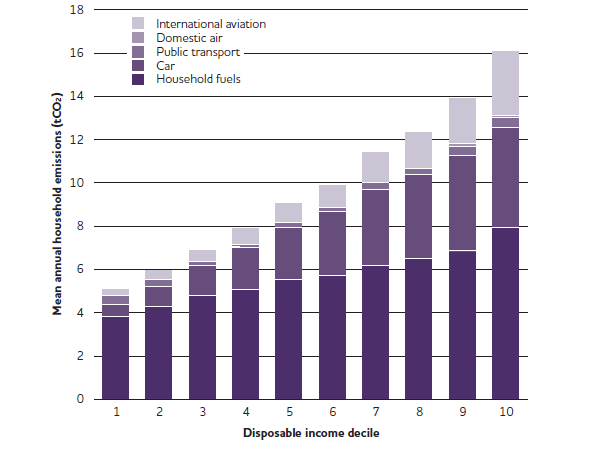
Figure 1.1: Mean annual household CO2 emissions from all sources by disposable household income decile (GB EFS dataset)7
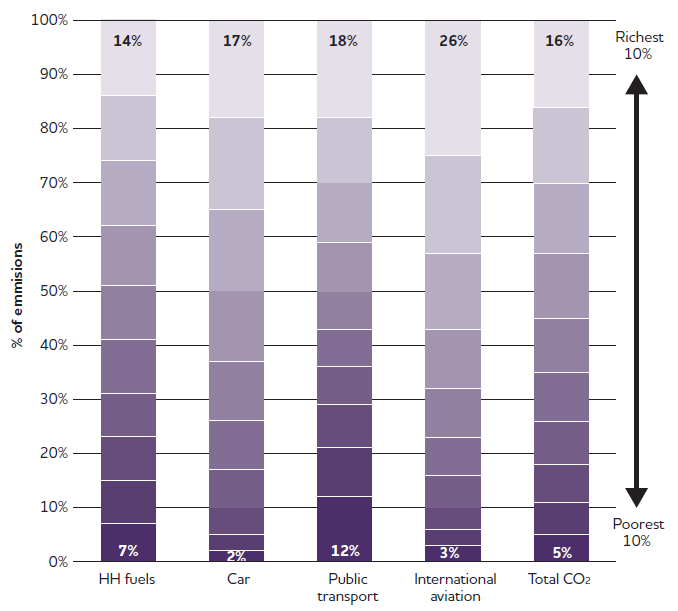
Figure 1.2: Proportion of household CO2 emissions attributed to each disposable income decile by emissions source, for Great Britain8
- Looking at the wider picture across all sources of direct and indirect carbon emissions, it is also true that lower income households are responsible for fewer emissions from other forms of consumption than higher income households. As well as direct emissions from home heating and transport, there are indirect emissions from consumption of goods and services (including from shopping and leisure activities). Both direct and indirect emissions rise with income9. However it is household energy bills where policy costs can fall disproportionately on the energy vulnerable.
- Although the richest use more energy and emit more carbon, energy bills typically represent a higher proportion of income for lower income households than those on higher incomes10, and so relative to ability to pay, low income households are also contributing more to energy bill-funded policies. In 2012, the poorest fifth of households spent 11% of their income on household energy; more than double the UK average of 5%11
- Low income households have fewer options to reduce their energy use without reducing their standard of living. Low income households have a more limited choice of housing and cannot fund energy efficiency improvements to their homes themselves. Forty-two percent of households below average income live in social housing, while 37% live in private rented sector housing12. Although social housing often has a high level of energy efficiency, much of the private rented sector housing stock has low energy efficiency. Reducing energy costs through improved energy efficiency is not an option for some low income households. In addition, some people, such as older people and people with a disability or long term illness, are particularly affected because they spend more time at home and require a higher living temperature, and therefore use more energy.
- Lower income households may pay more per unit for their energy. The poverty premium, whereby some consumers pay more for goods and services due to their position in the market, is well documented13. Those using prepayment meters have access to a limited range of tariffs, as do households without internet access, meaning they cannot access the cheapest tariff available14. They may also be prevented from switching if they are in arrears. In addition, many tariffs are two-tiered, with the price per unit becoming cheaper above a specified level of consumption, which means that low users pay more on average per unit.
- Funding carbon mitigation and fuel poverty policies through taxation would be fairer, as income tax is paid proportional to income. The current system of paying for some policies through increasing the cost of household essentials is disproportionately tough on those who struggle to afford these essentials. In contrast, income tax is paid proportional to earnings, and so those who are more able to pay contribute more.
- Carbon mitigation and fuel poverty policies provide benefits to some households, for example as free or discounted insulation and heating, or funding for a solar panel, but not all households benefit equally. Whether an individual household benefits depends on the design of the policy, its targets, and how it is implemented in practice. For example, in the case of the Energy Company Obligation, factors influencing distribution of benefits include whether: the property is suitable for measures covered by the policy; the household has certain characteristics such as receiving eligible state benefits; the policy has been advertised in the local area; the household trusts the company offering the measures, and how many measures the energy company plans to fund nation-wide. For the Feed-In Tariff, whether a household benefits would depend on factors including whether a household has sufficient savings to cover the upfront costs of a solar PV installation (or other qualifying technology), or if not, whether they are willing to enter into an agreement with a company which will finance the upfront costs in return for some of the benefits. Alternatively, households in rented accommodation can benefit if their landlord wants to install a technology funded by the Feed-In Tariff (this is most common in social housing). A 2013 study which modelled the impact of energy and carbon policies on annual household energy bills in England in 2020 found that the poorest 10% of households will see a reduction of 7% on the average energy bill, while the richest 10% of households will see an average reduction of 12%15. This is illustrated in Figure 1.3 below.
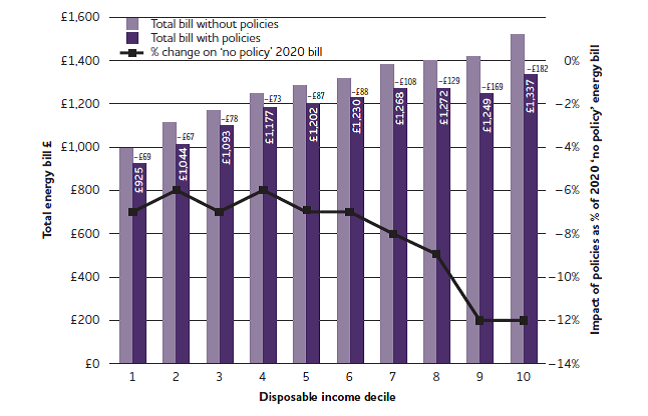
Figure 1.3: Impact of policies on actual household energy bills in 2020 by disposable income decile (England)16
- Even fuel poverty policies can be unfair for low income households which are contributing to the cost through their energy bills but not receiving the benefits. The current national policy for fuel poverty, the Home Heating Cost Reduction Obligation (HHCRO), part of the Energy Company Obligation, aims to install measures in low income households to reduce heating costs, but while all households pay for this through their energy bills, only some low income households receive the benefits. The households that receive the benefits may be taken out of fuel poverty, but this is at the cost of making energy more expensive for all low income households. In addition, households that receive benefits early in the lifetime of the policy have to pay less towards the policy than those who receive benefits later. Scotland and Wales have taxpayer-funded fuel poverty schemes in addition to HHCRO, but England does not.
- Energy costs have increased in recent years, and although energy policies are only a small part of this increase, their impact on low income households is substantial. The average bill for electricity and gas combined in the UK more than doubled between 1996 and 2014, from approximately £600 to just under £1,350 (Figure 1.4). 2015 saw a slight reduction in the average bill to £1,300, predominantly a result of small reductions by the Big Six energy companies in that year.
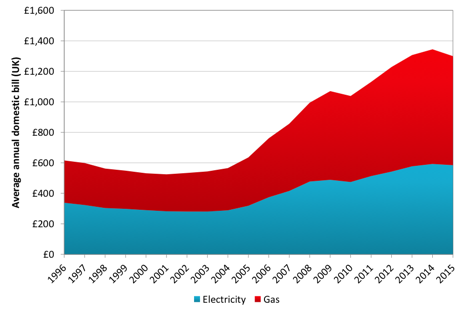
Figure 1.4: Average annual domestic electricity and gas bills for England and Wales from 1996 to 2015, based on standard credit payment prices (nominal prices)17
- The most significant factor affecting the long term trend of an increase in energy bills is the rise in price of wholesale gas.18 The components which Ofgem estimate make up the average gas and electricity bill in 2015 are shown in Figure 1.5. Although this shows average bills, the proportions of each element will be the same whatever the overall bill. For gas, wholesale costs make up the largest proportion of the cost at 46%, followed by network costs at 21% and operating costs at 13%. The cost of energy and climate change policies is 3% of the cost, less than the cost of VAT. For electricity, wholesale costs make up 37% of the bill, with network costs taking 24% of the bill, and operating costs also making up 13% of the cost. There are more policy costs on electricity bills, as some policies only affect electricity. These are the Renewables Obligation, Feed-In Tariffs, the EU Emissions Trading Scheme and the Carbon Price Floor (these last two are effectively carbon taxes).
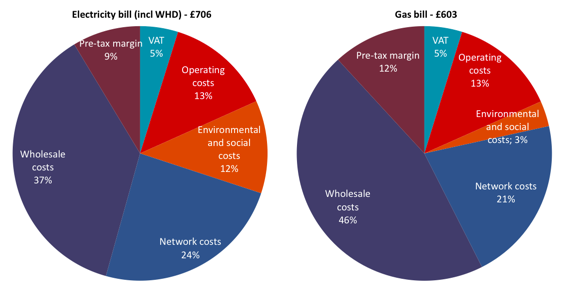
Figure 1.5: Estimated breakdown of average household gas and electricity bills in April 2015 to March 2016 (based on estimates made by Ofgem for a typical larger supplier)16
- The costs of policy measures funded through bills tend to disproportionately hit households that rely on electricity to heat their homes. Energy and climate change policies account for 12% of a typical electricity bill – almost three times as much as on a typical gas bill. Overall, for a dual fuel customer, energy and climate change costs represent only an estimated 7% of a total fuel bill, but this equates to roughly £94 a year20, which is a significant additional cost to a low income household.
- Increases in energy prices represent a proportionally greater financial burden for those on low incomes compared to more affluent households. The cost of fuel is only one component of total household expenditure, but as the price of fuel more than doubled between 2002 and 2012 the impact of higher bills is a significant factor affecting household incomes and contributing to poverty. The Joseph Rowntree Foundation's Minimum Income Standard research found that the cost of a minimum basket of goods and services has typically risen by between a quarter and just over a third between 2008 and 2014, and that the rising cost of energy played an important part in that, rising by 45% in that time21.
References
- JRF’s definition of poverty: ‘When a person’s resources (mainly their material resources) are not sufficient to meet their minimum needs (including social participation).’
- Ofgem (2013) Consumer Vulnerability Strategy
- DECC (2015) 2014 UK Greenhouse Gas Emissions, Provisional Figures
- Preston, I., White, V., Thumim, J., Bridgeman, T., and Brand, C (2013) Distribution of Carbon Emissions in the UK: Implications for Domestic Energy Policy, p.38
- Preston, I., White, V., Thumim, J., Bridgeman, T., and Brand, C (2013) Distribution of Carbon Emissions in the UK: Implications for Domestic Energy Policy, p.8
- See for example, Gough, Ian, Abdallah, Saamah, Johnson, Viki, Ryan-Collins, Josh and Smith, Cindy (2011) The distribution of total embodied greenhouse gas emissions by households in the UK, and some implications for social policy. CASEpapers, CASE/152. Centre for Analysis of Social Exclusion, London School of Economics and Political Science, London, UK
- JRF (2013) Monitoring poverty and social exclusion 2013
- Office for National Statistics (2014) 5 facts about household energy spending in the UK, 2002-2012
- JRF (2014) Poverty after housing costs by housing tenure
- See for example Hirsch, D. (2013) Addressing the Poverty Premium: Approaches to regulation
- Preston, I., White, V., Blacklaws, K. , Hirsch, D. (2014) Fuel and poverty: A Rapid Evidence Assessment for the Joseph Rowntree Foundation
- Preston, I., White, V., Thumim, J., Bridgeman, T., and Brand, C (2013) Distribution of Carbon Emissions in the UK: Implications for Domestic Energy Policy, p.45 NB. The assumptions about some policies and costs in this study are different from those shown in Box 2.
- Preston, I., White, V., Thumim, J., Bridgeman, T., and Brand, C (2013) Distribution of Carbon Emissions in the UK: Implications for Domestic Energy Policy, p.53
- DECC(2015), Average annual domestic electricity bills by home and non-home supplier
- Committee on Climate Change (2012) Energy prices and bills - impacts of meeting carbon budgets
- Ofgem (2015) Charts: Outlook for costs that make up energy bills
- Davies, A., Hirsch, D., and Padley, M. (2014) A minimum income standard for the UK in 2014, Joseph Rowntree Foundation

Built by:
![]()
© 2014 - Climate Just
Contact us