Who is affected by fuel poverty?


Credit: ©iStock/tbradford

On this page:


Defining fuel poverty


Approximately 2.35 million English households are estimated to be in fuel poverty in 2015 according to the new government definition1 in the Warm Homes and Energy Conservation Act:  ‘A person is to be regarded as living “in fuel poverty” if he is a member of a household living on a lower income in a home which cannot be kept warm at reasonable cost’2. Fuel poverty is caused by three main issues: low incomes, energy inefficient homes and energy prices.3


The UK government has recently changed the definition of fuel poverty used in England. Previously a household which needed to spend 10% or more of its total income to heat the home to an ‘adequate level of warmth’ was considered to be in fuel poverty, while anyone required to spend more than 20% was considered to be in severe fuel poverty.  The devolved governments in other parts of the UK are still currently using this definition.


In 2012, an in-depth review of fuel poverty statistics4 established the ‘low income, high cost’ (LIHC) indicator of fuel poverty as the new official definition for England (see Box 1 below). Essentially, under this definition, a household is in fuel poverty if its required total fuel costs are higher than the national average (median) fuel cost, and, were it to spend that amount, the household's remaining income would be below the standard government definition for poverty. This is illustrated in Figure 1.1 below. Households falling into the shaded area are fuel poor. Households must both be below the income threshold and have expected fuel costs above the average (median) fuel cost. Note that the household’s expected fuel cost is not its actual expenditure on fuel, but the amount that it would have to spend to heat the home to an ‘adequate level of warmth’, being defined as 21°C in the living room and 18°C in the rest of the home. In reality it is more likely that fuel poor households under-heat their homes to reduce their bills.


Box 1: The Low Income High Costs Definition of Fuel Poverty


According to the Government’s standard definition of poverty, a household is defined as being in relative poverty if it has an income lower than 60% of England’s median income.


The new low income high costs (LIHC) definition of fuel poverty identifies fuel poor households as those that are pushed into poverty as a result of high fuel costs and low incomes.


Households are defined as being low income (LI) if their remaining income after expenditure on fuel costs is then less than 60% of the median income after housing costs (AHC). Subtracting rent and mortgage costs from a household’s net income allows for the considerable regional variation in housing costs that occurs across England, most notably between London and the North of England.


One way of visualising the thresholds is to plot AHC income plus required fuel costs against fuel costs. As a result the income threshold slopes to the left because of the effect of adding on fuel costs to the income: higher fuel costs pull it more to the right. This is the representation used in the official fuel poverty publications and splits the population into four quadrants (Figure 1.1)


  • Low income, high costs (these are the fuel poor, in the bottom left quadrant)
  • Low income, low costs (top left)
  • High income, high costs (bottom right)
  • High income, low costs (top right).


It is important to note that in this calculation both incomes and fuel costs are ‘equivalised’; this is a statistical process that levels incomes and fuel costs to account for different compositions and numbers of people in households across the country. For incomes, the main purpose of this is to account for larger households requiring higher overall incomes to maintain the same standard of living as smaller households.


Fuel costs are equivalised using a specific set of factors determined for the purposes of the LIHC definition using total household size (total number of people). These are different from the factors used for income. Analysis of available survey data[1] suggests that the size of a household has the most significant impact on fuel bills. Calculated ‘required’ fuel costs are divided by the equivalisation factors shown in the table, in order to produce equivalised fuel costs.


Number of people in household

Fuel cost equivalisation factors for LIHC definition

1

0.82

2

1

3

1.07

4

1.21

5 or more

1.33


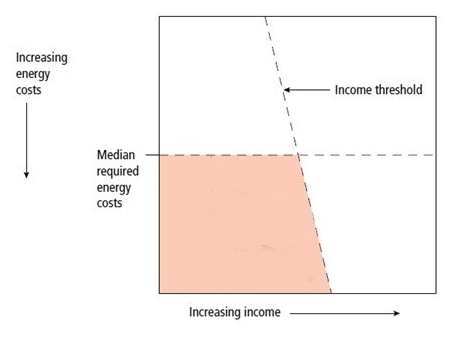
Figure 1.1: Representation of low income, high cost (LIHC) indicator5


The LIHC indicator measures both the number of households experiencing fuel poverty and also the 'depth' of fuel poverty or ‘fuel poverty gap.’ This is the gap between how much a household needs to spend to maintain a warm home (taking account of household size) and the average cost of heating a home, taking into account their income, if appropriate. This can be thought of as the amount by which bills would have to decrease to take the household out of fuel poverty. In Figure 1.1, it is the distance that they would have to move upwards to leave the shaded area. The total and average fuel poverty gap is usually reported alongside the headline total number of fuel poor. For both definitions, fuel poverty statistics are modelled, based on the English Housing Survey.  DECC publishes a description of the modelling methodology6.


Under the new indicator, fewer households are classified as fuel poor in comparison with the previous definition. The new indicator puts the number of households in fuel poverty in England at 2.35 million (2013), compared to 3.2 million under the previous definition (2011).  This is a change from 14.6% of households to 10.4% of all households classified as being in fuel poverty. Furthermore, the number of fuel poor households considered to be vulnerable (that is, containing ‘the elderly, children or someone who is disabled or has a long term illness’) fell from 2.5 million to 1.8 million(Table 1.1). Both definitions are used here, (depending on the data provided by the source documents), indicating which definition is used each time. Where possible, the LIHC indicator, as the most up to date one for England, is used.


Old 10% Definition (2011 data)

New LIHC Definition (2013 data)

All fuel poor households

3,202,000

2,347,000

Of these, households which are vulnerable (i.e. containing the elderly, children, or someone who is disabled or has a long term illness)

2,498,000

1,821,000

Table 1.1: Households in fuel poverty according to 10% definition (2011) and LIHC definition (2013)8


While it is generally accepted that three key factors create fuel poverty: energy inefficient properties, high energy bills and low incomes, some groups are more likely to experience fuel poverty.  All figures given below are according to the LIHC definition9:

  • People in inefficient homes: 51% of all fuel poor households have an Energy Performance Certificate (EPC) rating of E or below.
  • Young people: 45% of all households experiencing fuel poverty include at least one person under the age of 16.
  • People with a disability or long term illness: 35% of all fuel poor households include at least one person with a disability or a long term illness.
  • Tenants in the private rented sector (PRS): 35% of all people experiencing fuel poverty live in privately rented homes. This is double the combined percentage associated with homes which are rented from a local authority (8%) or through a housing association (10%).
  • People using pre-payment meters (PPM):  33% of all fuel poor households use an electricity PPM. This is low compared to other groups due to the relatively small proportion of people using this form of payment compared to others such as direct debit.
  • Older people: just over 23% of all fuel poor households include at least one person over the age of 60.
  • Households not connected to mains gas (known as off gas12) households are usually found in rural areas and rely on more expensive heating options, such as electricity, oil and solid fuel. Due to the fact that the majority of households in England are connected to the gas network, only 19% of all households experiencing fuel poverty fall into the off gas13 category.  However, the depth of fuel poverty for these households can be severe, with the average fuel poverty gap14 for households in non-cavity walled properties off the gas grid being £789, compared to £412 for the same types of properties located on the gas grid.
  • Figure 1.2 illustrates the figures, highlighting what proportion of all fuel poor households in England have each characteristic described above. For example, 35% of all households experiencing fuel poverty in England live in private rented accommodation. Note that the characteristics are not mutually exclusive; for example a private sector tenant may also have a long term illness or a person over 60 may also live in a property with a low EPC rating.


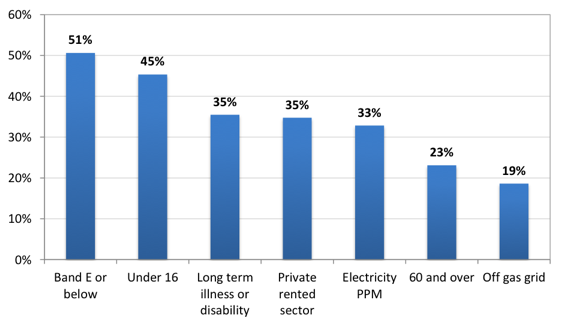
Figure 1.2: At-risk characteristics for fuel poverty, showing the percentage of all fuel poor households found in each group (LIHC indicator)10


A large proportion of households with under 16s are fuel poor, which reflects the fact that larger households have higher living costs and therefore their incomes (adjusted for living costs) is lower, which pushes them into fuel poverty. One of the reasons for defining a new fuel poverty indicator was that the 10% indicator did not account for the number of people in the household, leading to too many small households (i.e. single people and couples) being counted as fuel poor, and not enough large ones (i.e. families). Accounting for the size of the household in the LIHC has changed this balance, and as a result more households with children are identified as fuel poor.  


People with a disability or long-term illness


Disabled people are twice as likely to live in poverty as non-disabled people, making them more likely to experience fuel poverty.11 Disabled people are far less likely to be in employment than non-disabled people, and when in work they earn less on average. They are also less likely to have savings. Given that low income is one of the strongest indicators of fuel poverty, the increased likelihood of disabled people living on a low income almost certainly means a greater likelihood of experiencing fuel poverty.12


Under the LIHC measure of fuel poverty, in 2013, 12% of households containing someone with a long term illness or disability were fuel poor.13 Under the 10% measure, this figure was 17.4% in 2011.14 According to the English Housing Survey 2010-11,15 20% of households containing at least one member with a mental health problem experience fuel poverty. Cutting back on fuel costs is common among those people living with a disability who have low income and debts to pay off.16


Older people


Almost a quarter of households (23%) experiencing fuel poverty in 2013 included at least one person aged over 60 under the LIHC definition, compared to double this figure under the old definition in 2011.17 The large difference is due to many older people on low incomes living alone in properties that are larger than required to meet their needs and which are expensive to heat. Under the 10% definition of fuel poverty, these households are classified as being fuel poor, but under the LIHC indicator, fuel costs are adjusted for household size, therefore reducing the fuel costs used in the calculation for these households.  


Figure 1.3 shows the proportion of all fuel poor households in England by household composition in 2013, using the LIHC definition, and comparing that with the 10% definition (using 2011 data, the most recent available). Under the LIHC definition, couples with dependent children form the largest proportion at 30%, followed by lone parents with dependent children at 17% and lone people under 60 at 13%. In contrast, the 10% definition shows one person households aged 60 or over to be the largest group.


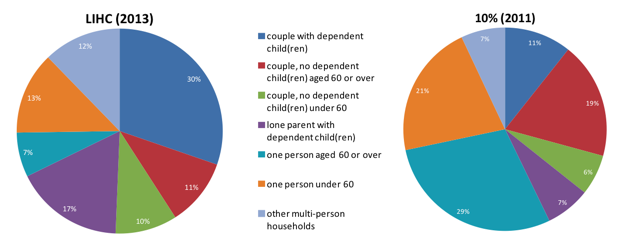
Figure 1.3: Proportion of all fuel poor households by household composition, 2013 (LIHC definition) (DECC, 2015)18


Older people living on fixed pensions have little opportunity to increase their income and so have fewer opportunities to combat fuel poverty.  While fuel poverty is more prevalent among families than among older households (under the LIHC indicator), families are more likely to move into and out of fuel poverty (for example, becoming fuel poor as the family becomes larger and one adult stops working to take care of children, and moving out of fuel poverty when children are older if both adults are working again). In contrast, older households on fixed pensions have fewer possibilities to move out of fuel poverty.


Fuel poverty among older people can be particularly acute in rural areas. This is because houses in rural areas tend to have lower energy efficiency and may not be connected to the gas grid, meaning that people have to use more expensive heating fuels, such as oil, solid fuel, or electricity for heating their homes.19


Children and young people


In England there were over 1.1 million households with dependent children living in fuel poverty in 2013.  Of these, 1,064,000 households had at least one child under the age of 1620 (see Table 1.2).  


Household Type

England

All fuel poor households

2,347,000

Households with dependent children

1,112,000

Of which households with under-16s

1,064,000

Table 1.2: Breakdown of English Households for 2013 – LIHC Definition21


A 2012 survey by the national children’s charity Barnardo’s found that the increasing austerity of the last three years has led to 84% of the families they work with cutting back on heating. In addition 74% were cutting back on food; and 60% cutting back on buying clothes.22 Many were in debt to their gas or electricity supplier and were cutting back spending on essentials in order to pay their energy bills. 


Living in a cold home has negative impacts on children’s health and wellbeing. For example, there is evidence for both lower weight gains in young children and babies and also increased hospital admission rates for children.23


Children who live in privately rented accommodation are more commonly affected by fuel poverty than children living in other tenures.  Under the 10% indicator, nearly 15% of dependent children living in privately rented housing are living in fuel poverty, compared to around 9-10% of children living in all other tenures (see Table 1.3). Equivalent figures are not available for the LIHC indicator, but are likely to be higher given the LIHC indicator's emphasis on household size.


Number of children in fuel poverty

% of children in fuel poverty in each tenure

Housing associations

220,552

16.06%

Owner occupied homes

1,038,316

16.10%

Local authority housing

152,472

15.25%

Private rented accommodation

815,233

30.70%

Table 1.3: Dependent children in fuel poverty by tenure in England, 2013, using LIHC definition (source: EHS 2013)24


Tenants in privately rented housing


One in five private rented sector households live in fuel poverty according to the LIHC definition, the highest proportion of any tenure type.25 Private rented households make up 35% of all fuel poor households in England, as shown in Figure 1.2 and Figure 1.4. Those who rent generally have lower incomes than owner occupiers.26 Currently, the supply of social housing in the UK does not meet demand, leaving many vulnerable households in the less regulated, more expensive private sector. Rents in this sector are considerably higher, at £176 per week on average, compared with £98 for housing association renters and £89 for local authority renters.27 This leaves a much lower household income to spend on household fuel.      


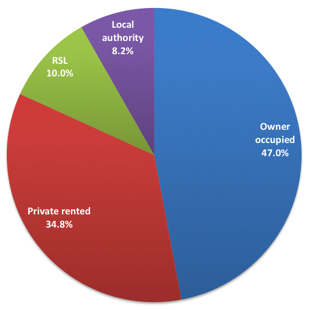
Figure 1.4: Fuel poor households by tenure (DECC, 2015)28


The private rented sector is growing, potentially meaning more households may be at risk of fuel poverty. Between 2001 and 2011, the number of households renting privately in England increased to 3.7 million (an increase from 12% to nearly 17% of households).29


The private rented sector has a greater proportion of energy inefficient homes than other tenures. The private rented sector is twice as likely to be of a non-decent standard compared to social housing (30% compared to 15%) and is also more likely to have a lower EPC rating.30 While the government has provided funding for improvements to social housing through the Decent Homes programme (which has an element covering thermal comfort)31, the private rented sector is not included in the scheme. This is a significant problem as private sector properties are more likely to be older and therefore more expensive to insulate32 and there is little incentive for private landlords to pay for such improvements.


Properties in the private rented sector may have fewer main heating options compared to other tenure types.  Many have no gas connection or the gas connection is not used.33 Heating systems in privately rented properties can often be old, inefficient and poorly maintained, which can lead to higher operating costs.34 People living in private rented homes are over four times more likely to be living in a cold home than people living in social housing.35 Over 400,000 privately rented homes are classified as a Category 1 ‘excess cold’ hazard under the Housing, Health and Safety Rating System (HHSRS).36  This is around a tenth of all privately rented homes in England.


Tenure

Sample size

Mean SAP

Owner occupied

4,994

58.5

Privately rented

2,590

58.4

Social rented


        Local authority

2,214

64.9

        Housing association

2,700

66.2

        All social rented

4,914

65.6

All tenures

12,498

59.7

Table 1.4: Energy efficiency rating for housing in different tenures (EHS, 2013-14)37


Prepayment meters


Households that use prepayment meters are more likely to experience fuel poverty than those paying by other means. One quarter of all households using prepayment meters are fuel poor, compared to less than one in ten of those paying by direct debit and one in six of those paying by standard credit.  Some low income households prefer prepayment meters even when they know these are more expensive because it enables them to more easily manage and keep within their budgets, but as a result, they may be suffering a poverty premium.


Households using prepayment meters are most affected by price rises because these have an immediate effect, compared to households on fixed price credit tariffs or direct debit payments. These other forms of payment allow costs to be spread, so households have more time to adjust to price rises.38


People living in poorly insulated homes with a low EPC rating


Three quarters of fuel poor households (LIHC definition) live in properties characterised by low energy efficiency, with an E, F or G Energy Performance Certificate (EPC) rating.39  EPC ratings range from band A, with 92-100 SAP points (the most efficient) to band G, with 1-20 SAP points (the least efficient).40


Terraced or semi-detached properties with pre-payment meters, non-cavity walls, built before 1945 and with fixed or portable heating are more likely to have low EPC ratings.41 Solid walled properties make up  45% of all homes occupied by fuel poor households (LIHC indicator) despite only representing around 30% of the total housing stock, while more than two thirds of fuel poor households live in either terraced or semi-detached properties. Houses built before 1945 account for two thirds of the aggregate fuel poverty gap. As such, properties are harder to insulate, due to either being either solid walled or having narrow cavities that are harder to fill. These older properties are also home to over half of all fuel poor households living in fuel poverty, despite accounting for just over a third of properties nationally.


In very hot weather, overheating can be a problem in both poorly insulated properties and some well insulated properties. Under-insulated top floor flats can suffer from overheating in very hot weather.42 Studies have also found that overheating can be a problem in well insulated buildings43, linked to high air tightness and poor ventilation, and so it is important when retrofitting insulation to take account of solar and internal heat gains and to make sure there is adequate ventilation.44 See the section on adapting buildings for more information.


Back to the top


References

  1. Annual Fuel Poverty Statistics Report, 2015 (DECC 2015).
  2. Warm Homes and Energy Conservation Act
  3. Hills J. (2012) Getting the measure of fuel poverty. CASE report 72. Centre for Analysis of Social Exclusion for Department of Energy and Climate Change (DECC) para 55, p.38
  4. Hills J. (2012) Getting the measure of fuel poverty. CASE report 72. Centre for Analysis of Social Exclusion for Department of Energy and Climate Change (DECC)
  5. Adapted from Hills J. (2012) Getting the measure of fuel poverty. CASE report 72. Centre for Analysis of Social Exclusion for Department of Energy and Climate Change (DECC), p.9
  6. DECC (2014) Fuel poverty methodology handbook
  7. DECC (2015) Fuel poverty detailed tables 2013
  8. DECC (2015) Fuel poverty detailed tables 2013 (for Low Income High Costs indicator) and DECC (2015) Fuel poverty detailed tables 2011 (for 10% indicator) 
  9. Data from DECC (2015)  Fuel poverty detailed tables 2013
  10. DECC (2015) Fuel poverty detailed tables 2013
  11. Parckar, G (2008) Disability Poverty in the UK. Leonard Cheshire Disability
  12. Laxton, C. and Parckar G. (2009) Fuel poverty and disability. Leonard Cheshire Disability
  13. DECC (2015) Fuel poverty detailed tables 2013
  14. DECC (2013) Fuel poverty detailed tables 2011
  15. Thomson, H., Snell, C. and Bevan, M. (2013) Fuel poverty and disability: a statistical analysis of the English Housing Survey. Department of Social Policy and Social Work, The University of York, York
  16. Kober, C (2005) In the Balance: Disabled people’s experiences of debt. Leonard Cheshire Disability
  17. For LIHC figures: DECC (2015) Fuel poverty statistics 2013. For 10% figures: DECC (2013) Fuel poverty statistics 2011
  18. DECC (2015) Fuel poverty statistics 2013
  19. Hills J. (2012) Getting the measure of fuel poverty. CASE report 72. Centre for Analysis of Social Exclusion for Department of Energy and Climate Change (DECC).
  20. DECC (2015) Fuel poverty statistics 2013
  21. ACE (2014) Fuel poverty: 2014 update. This document uses both definitions of fuel poverty although not all stats are reported using both definitions.
  22. Barnardo’s (2012) Priced out: The plight of low income families and young people living in fuel poverty.
  23. Ibid
  24. Department for Communities and Local Government. (2015). English Housing Survey, 2013: Housing Stock Data. UK Data Service. SN: 7802
  25. DECC (2015) Fuel poverty statistics 2013
  26. Stockton, H. and Campbell, R. (2011) Time to reconsider UK energy and fuel poverty policies? York: JRF
  27. DCLG (2015) English Housing Survey Headline Report 2013-4
  28. DECC (2015) Fuel poverty statistics 2013
  29. Using Census data. Census 2001 dataset KS18, Census 2011 dataset KS402EW.
  30. DCLG (2015) English Housing Survey Headline Report 2013-4
  31. DCLG (2015) Policy Paper, 2010 to 2015 government policy: rented housing sector, Appendix 5: decent homes: refurbishing social housing
  32. DCLG (2015) English Housing Survey Headline Report 2013-4
  33. English National Private Tenants Association submission to the Energy and Climate Change Select Committee (2011) Fuel poverty in the private rented and off grid sectors
  34. English National Private Tenants Association submission to the Energy and Climate Change Select Committee (2011) Fuel poverty in the private rented and off grid sectors
  35. A minimum energy efficiency standard for private rented properties: a joint statement  
  36. English National Private Tenants Association submission to the Energy and Climate Change Select Committee (2011) Fuel poverty in the private rented and off grid sectors
  37. DCLG (2015) English housing survey 2013: energy efficiency of English housing report
  38. Anderson, W., White, V., and Finney, A. (2010) You just have to get by: Coping with low incomes and cold. Study funding by eaga Charitable Trust 
  39. Anderson, W., White, V., and Finney, A. (2010) You just have to get by: Coping with low incomes and cold. Study funding by eaga Charitable Trust 
  40. Hills J. (2012) Getting the measure of fuel poverty. CASE report 72. Centre for Analysis of Social Exclusion for Department of Energy and Climate Change (DECC) 
  41. Energy Key, The EPC Explained
  42. Hills J. (2012) Getting the measure of fuel poverty. CASE report 72. Centre for Analysis of Social Exclusion for Department of Energy and Climate Change (DECC) 
  43. DCLG (2012) Investigation into Overheating in Homes: Literature Review
  44. Beizaee, A., Lomas, K.J. and Firth, S.K., 2013. National survey of summertime temperatures and overheating risk in English homes. Building and Environment, 65, pp.1-17 


Why is it important to act?

Credit: ©iStock/koinseb

On this page:


General legal and policy context for action


The Government has proposed a target to ensure that as many fuel poor homes as is reasonably practicable achieve a minimum energy efficiency standard of band C, by 2030.1 This would replace the recently abolished target to eradicate fuel poverty by 2016.


The Home Energy Conservation Act (HECA) 1995 and the Warm Homes and Energy Conservation Act 2000 legally require local authorities to take action on fuel poverty, as far as reasonably practicable.


Landlords have a duty of care to minimise the effects of excess cold on their tenants. The Housing Health and Safety Rating System is a guidance document used by local authorities to assess risks to residents of rented properties, including excess cold.  The guidance was created as a result of the Housing Act 2004, which puts emphasis on any adverse effects to the occupants rather than the specific condition of the building itself.  The aim of any inspection is to identify and minimise any potential hazards that may pose a risk to health and wellbeing.  The Housing Health and Safety Rating System guidance specifically mentions excess cold as being such a risk and states the importance of adequate heating and insulation in rented homes to safeguard against this.


National guidance highlights that public health workers have a role to play in tackling fuel poverty. The UK Health Forum has produced guidance in association with several stakeholders, to inform both clinical and non-clinical staff in public health teams about the negative effects of cold homes on health.  The National Institute for Health Care and Excellence has also recently published a draft public health guideline on the health risks associated with cold homes.  Front line workers have a key role to play in identifying patients in or at risk of fuel poverty and taking steps to help them receive assistance. 


Health implications of cold homes


The Marmot review highlighted how cold homes can lead to health problems for their residents, especially children:

  • Cold housing increases the level of minor illnesses such as colds and flu and exacerbates existing conditions such as arthritis and rheumatism.
  • There is a strong relationship between cold temperatures and cardio-vascular and respiratory diseases.
  • Children are particularly vulnerable: those living in cold homes are more than twice as likely to suffer from a variety of respiratory problems, including asthma and bronchitis, than children living in warm homes.
  • Children living in damp and mouldy homes are up to three times more likely to suffer from coughing, wheezing and respiratory illness as their peers who live in dry homes.2


Fuel poverty causes excess winter deaths, especially affecting older people and those in ill health. Some 10% of excess winter deaths could conservatively be attributed directly to fuel poverty.3  Living at low temperatures, as a result of fuel poverty, is likely to be a significant contributor to the excess winter deaths that occur each year (a total of 27,000 each year over the last decade in England and Wales), which mostly affect older people.4


Circulatory and respiratory diseases are the largest causes of excess winter deaths. Circulatory diseases account for some 40% of excess winter deaths, while respiratory diseases count for around 30%. In contrast, hypothermia and influenza cause only a small proportion of excess winter deaths.5


Older people are more likely to be vulnerable to colder weather. Older people are more likely to have pre-existing medical conditions, as well as being vulnerable to hypothermia due to being less active than younger people and having less body fat. They are also likely to spend more time at home than other age groups and so need to heat their homes for longer.6


Cold homes are a cost to the health service and tackling fuel poverty could save money. The Chief Medical Officer estimated the annual cost to the NHS of treating winter-related disease due to cold private housing to be £859 million and suggested that investing £1 in keeping homes warm saved the NHS 42 pence in health costs.7  When all medical conditions that are aggravated by cold homes are also considered, the total cost to the NHS is even higher, at approximately £1.36 billion per year.8


Cold homes affect people’s mental health. The Marmot Review found evidence to suggest that adolescents living in cold housing are up to five times more likely to experience mental health problems than those that have always lived in warm homes, and that, among all age groups, mental health is negatively affected by cold homes and fuel poverty.9


Broader societal impacts


Fuel poverty affects more than a million children in England,10 and eradicating child poverty is a UK policy goal. The Child Poverty Act 2010 seeks to ensure that child poverty is eradicated by 2020.


Fuel poverty may affect children’s education. Health problems can lead to absence from school, or a cold home may mean there is no warm, separate room for children to do their homework.11


For adults, ill health can lead to enforced absences from work. Certain types of illness, such as respiratory disease, may also restrict choices of potential employment for those without work.12


Households experiencing fuel poverty are unduly penalised by policy costs on energy bills. People who experience fuel poverty usually use less energy and therefore have lower total carbon emissions than other households, meaning they contribute the least to climate change.  However, they still pay for carbon reduction policies through their energy bills13 despite making limited gains from doing so, leading to a triple injustice where they pay proportionately more of their income towards energy costs than higher income households, while benefiting less from policy measures and being less responsible for emissions.  Information on which households emit most carbon can be found here.


Groups who are likely to experience fuel poverty are also vulnerable to the impacts of climate change and extreme weather events (see Who is vulnerable?) They are therefore more likely to see disproportionate impacts on their health and wellbeing as a result of some of the same personal, environmental and social factors which help to explain patterns of fuel poverty. Information on who is vulnerable to the impacts of climate change and severe weather events can be found here.


Fuel poverty is part of wider poverty and so should be included as part of overall anti-poverty strategies locally and nationally.


Back to the top


References

  1. DECC (2014). Cutting the cost of keeping warm. A new fuel poverty strategy for England.
  2. Marmot Review Team (2011) The Health Impacts of Cold Homes and Fuel Poverty.
  3. Hills J. (2012) Getting the measure of fuel poverty. CASE report 72. Centre for Analysis of Social Exclusion for Department of Energy and Climate Change (DECC), p.27 of full report, based on evidence from the Marmot review team (see footnote 60)
  4. Hills J. (2012) Getting the measure of fuel poverty. CASE report 72. Centre for Analysis of Social Exclusion for Department of Energy and Climate Change (DECC).
  5. Marmot Review Team (2011) The Health Impacts of Cold Homes and Fuel Poverty.
  6. Marmot Review Team (2011) The Health Impacts of Cold Homes and Fuel Poverty
  7. Annual Report of the Chief Medical Officer (2009)
  8. Butcher, J. (2014) Fuel Poverty: How to improve health and wellbeing through action on affordable warmth. A report published by the UK Health Forum and partners.
  9. Marmot Review Team (2011) The Health Impacts of Cold Homes and Fuel Poverty.
  10. Based on 1,027,000 families with dependent children in fuel poverty, in DECC statistics: DECC (2014) Fuel poverty detailed tables 2012.
  11. Marmot Review Team (2011) The Health Impacts of Cold Homes and Fuel Poverty.
  12. UK Fuel Poverty Strategy (2001) Chapter 1: The causes and effects of fuel poverty.
  13. Preston, I., White, V., Thumim J. and Bridgeman, T. (2013) Distribution of carbon emissions in the UK: implications for domestic energy policy. JRF, York.


Where are the people we are concerned about?


Credit: ©iStock/DonNichols


There is pronounced regional variation in the distribution of households experiencing fuel poverty. The West Midlands has the highest proportion of its households living in fuel poverty (around 13.8%), while the South East has the lowest proportion (around 8.2%).  The regions with the greatest proportion of all of England's fuel poor households are the West Midlands and the North West. The North West also experiences the greatest fuel poverty gap (Table 3.1). Southern regions tend to have average annual temperatures approximately 2⁰C higher than in the Midlands and Northern England according to the Met Office, which is one reason fuel poverty is higher in the Midlands and North.  Those regions with larger populations naturally tend to have a higher proportion of all of England’s fuel poor households.


Region

% of households in fuel poverty in the region

% of all fuel poor households in England

Aggregate fuel poverty gap in the region (£m)

Average fuel poverty gap per fuel poor household (£)

 East England

9.0%

9.3%

95

436

 East Midlands

10.0%

8.6%

81

401

 London

10.0%

13.9%

99

304

 North East

12.0%

5.8%

34

255

 North West

11.0%

14.3%

104

312

 South East

8.0%

12.7%

117

395

 South West

12.0%

11.7%

123

447

 West Midlands

14.0%

13.6%

137

427

 Yorkshire and the Humber

11.0%

10.2%

86

359

 All

10.0%

100.0%

877

374

Table 3.1: Regional distribution of fuel poverty in England, LIHC definition, 2012 (DECC, 2014)1


The levels of fuel poverty within an English local authority and changing trends over time (based on the 10% definition) can be seen in the Department for Energy and Climate Change (DECC) online maps. For more detailed information about fuel poverty at the neighbourhood level in England, see the map tool which provides maps at the local authority and Census lower super output area level.


Mapping fuel poverty by local authority and census lower super output area in 2012 shows considerable variation in rates across England (LIHC definition). See Figure 3.1 and Figure 3.2 (the legend categories are based on where there are natural breaks in the data). There is variation throughout England but in very general terms, at local authority level there are particular concentrations of fuel poverty in local authorities in the Midlands and North and, to a lesser extent, the South West. When looking at census lower super output area level, those areas of higher fuel poverty are still visible, although the picture is more varied, and an area of very high fuel poverty stands out at the border with Wales, with pockets of high fuel poverty across the South West. 


Figure 3.1: Percentage of households in fuel poverty in each local authority in England, LIHC definition (based on county/unitary councils)2


Figure 3.2: Percentage of households in fuel poverty in each LSOA in England, LIHC definition3


Mapping fuel poverty by local authority and census lower super output area in 2012 using the old 10% definition, also shows considerable variation in rates across England. See Figure 3.3 and Figure 3.4 (the legend categories are based on where there are natural breaks in the data). Note that the LIHC and 10% maps should not be directly compared as the legend categories are different. For the 10% definition, the most obvious difference is that the South East, London and parts of the East of England generally show lower levels of fuel poverty than the rest of the country.  This is largely due to the difference in the way housing costs are taken into account in the two different indicators.


Figure 3.3: Percentage of households in fuel poverty in each local authority in England, 10% definition (based on county/unitary councils)4


Figure 3.4: Percentage of households in fuel poverty in each LSOA in England, 10% definition5


Fuel poverty tends to affect a higher proportion of rural than urban households and the average fuel poverty gap is higher in rural locations. Table 3.2 shows fuel poverty by extent of rurality in 2012, using the LIHC definition. Rural areas are also more likely to have colder temperatures than urban areas, due to the Urban Heat Island effect, which leads to higher temperatures around densely populated urban areas (see the section on Adapting Buildings). For information about types of households affected by fuel poverty see Section 1: Who is affected by fuel poverty? Despite the fact that the majority of the fuel poor live in urban areas (this reflects the higher urban populations and high cost of living in many urban areas, especially in the south east), the needs of the rural fuel poor should not be overlooked.


Rurality

% of households in this group that are in fuel poverty

% of all fuel poor households that are in this group

Average fuel poverty gap (£)

 Urban

10

79%

£304

 Rural - town and fringe

8

8%

£346

 Rural - villages, hamlets and isolated dwellings

14

13%

£820

Table 3.2: Fuel poverty by rurality, LIHC definition 2012 (DECC, 2014)6


The depth of fuel poverty in rural households is much greater than in urban areas.  The average fuel poverty gap for the most rural households (villages, hamlets and isolated dwellings) is £820 compared to £304 for urban households.7


Being off the gas grid drives high costs, with an average fuel poverty gap of £780 for households living in such dwellings (table 3.3).8 While 13% of English households are off gas, nearly 19% of fuel poor households in England are off gas. Households living in properties that are both off the gas grid and in rural areas face some of the highest fuel poverty gaps of all.9


Gas grid connection

% of all households

% of households in this group that are in fuel poverty

% of all fuel poor households that are in this group

Average fuel poverty gap (£)

On gas grid

87%

10%

81%

£315

Not on gas grid

13%

15%

19%

£629

Table 3.3: Fuel poverty by gas grid availability, LIHC definition 2012 (derived from DECC, 2014)10


Back to the top


References

  1. DECC (2014) Fuel poverty detailed tables 2012. Detailed tables under the low income high costs indicator.
  2. Based on data from DECC (2014) Fuel Poverty Sub-Regional Statistics for 2012.
  3. Based on data from DECC (2014) Fuel Poverty Sub-Regional Statistics for 2012.
  4. Based on data from DECC (2014) Fuel Poverty Sub-Regional Statistics for 2012.
  5. Based on data from DECC (2014) Fuel Poverty Sub-Regional Statistics for 2012.
  6. DECC (2014) Fuel poverty detailed tables 2012. Detailed tables under the low income high costs indicator.
  7. Hills J. (2012) Getting the measure of fuel poverty. CASE report 72. Centre for Analysis of Social Exclusion for Department of Energy and Climate Change (DECC).
  8. Derived from DECC (2014) Fuel poverty detailed tables 2012. Detailed tables under the low income high costs indicator.
  9. Hills J. (2012) Getting the measure of fuel poverty. CASE report 72. Centre for Analysis of Social Exclusion for Department of Energy and Climate Change (DECC).
  10. DECC (2014) Fuel poverty detailed tables 2012. Detailed tables under the low income high costs indicator.


What can be done?


User feedback from Cambridge Climate Just event, January 2015 © Climate UK


On this page:


Identify those living in fuel poverty


If local authorities and their partners understand where fuel poor households are located and the specific reasons for their fuel poverty, this can help to target them for programmes such as home improvement initiatives. No single measure can be used to easily pinpoint households living in fuel poverty; however, the characteristics of people and their dwellings listed below can help to identify the households or areas affected.1


Working in partnership with others may help to overcome some of the difficulties in identifying specific groups who are more likely to experience fuel poverty and problems caused by data protection issues.  Certain groups are known to be at greater risk of fuel poverty such as people with a disability or long term illness, older people and children (see Section 1: Who are we concerned about?).  However, due to data protection regulations, personal information cannot be shared without the permission of the person. This can create problems for local authorities when designing outreach programmes that require sharing personal details with a delivery partner (see Government guidance).  Information regarding who uses prepayment meters is held by energy companies - they would similarly be unable to share this information with local authorities due to data protection. See the section on partnership working for more on how collaboration can help and the health section on how existing registers might be used.


Fuel poor households can be identified using non-personal information. In view of limitations due to data protection of personal characteristics, local authorities can alternatively identify fuel poor households using three main criteria: low income, private rented housing and low energy efficiency housing.  While this data is not as useful as that discussed in the previous paragraph, it is widely available. It is discussed in more detail below:

  • Low income households, including older or disabled people, or low-income families with dependent children. Areas with a high proportion of low income households can be identified by using indicators such as average income, unemployment or proportion of people employed in jobs requiring only elementary skills. See the map tool for links to maps of some of these indicators for your local area. However, quite a large number of households can potentially move in or out of poverty quite quickly. Up to one-third of UK households experience financial strain, finding it difficult to manage, within any five-year period. Around five percent of households remain poor over longer periods of time, and those who are most vulnerable to the cold (pensioners, the long term sick and disabled, and young children), are over-represented in this group. Therefore it is this group of long-term poor households that is the most likely to be affected by fuel poverty.2


  • Private tenants.  Privately rented properties tend to have the lowest energy efficiency and a large proportion of private tenants have a low income.  Areas with a high proportion of private renters can be identified based on the data in the map tool.  Private renters may be difficult to identify due to moving more frequently than other tenures; in 2012-13, a third of private rented sector tenants had moved within the past year.3 However, areas with a high proportion of privately rented properties can be identified, either through Census data, or at a higher resolution, by local authorities keeping registers of privately rented properties in a given area. Many local authorities already do this and use registers for providing targeted information.  Those households waiting for social housing or in receipt of housing benefits may be the most likely private renters to be affected by persistent fuel poverty.4


  • Properties characterised by low energy efficiency. Inefficient dwellings including terraced or semi-detached properties with non-cavity walls, usually built before 1945, can also be identified, for example by using Google Streetmap, thermal imaging, historical area maps and maps of conservation areas for older properties, and/or using Energy Performance Certificate data which can be bought from the government register. It can also be bought from private companies which sell marketing data. In a similar way to identifying private tenants, properties of a particular age or type are usually clustered together in a particular area as they were built at the same time.   


GP referrals may provide a useful way of finding and targeting members of fuel poor households living with fuel poverty who have other characteristics which make them sensitive to cold temperatures.  The health problems associated with living in cold homes mean GPs are well placed to identify those suffering the negative consequences of fuel poverty and see that they get help.  See the Blackpool case study below.


Below are several case studies of effective approaches used by local authorities to identify fuel poor households. Learning from other local authorities’ experience is a useful way to develop plans in other localities:

  • Salford's Affordable Warmth Scheme used thermal imaging to identify households that would benefit from either free or discounted insulation. The scheme utilised CERT funding and targets were surpassed as uptake was so high.
  • Warmer Worcestershire has produced a heat loss map based on the energy efficiency characteristics of properties.
  • Blackpool City Council ran a pilot project with NHS Blackpool that used their flu vaccine mailing lists to inform people about the options available to them.  This avoids the issue of sharing personal data by instead targeting people likely to be at risk in cold weather.


Provide relevant information to individuals and households


Train a broad range of relevant front line staff in energy efficiency, fuel poverty and maximisation of income. Provide basic training in energy efficiency to council staff, Citizens Advice Bureaux, Registered Social Landlords, Age UK, and other organisations working with vulnerable people in your area. Seek alternative sources of funding to provide training for a wider range of agencies.5 Almost 70% of Barnardo’s family workers reported that families do not know what support is available6 so ensuring people know what help is available (and keeping this knowledge up to date) needs to be a key priority.


Distribute energy efficiency leaflets to residents in your area. For example, make leaflets available at key locations, such as doctors surgeries, job centres, travel hubs, libraries etc. See the Government’s Keep Warm Keep Well booklet for an example of information, or the public health messages from the Cold Weather Plan for England


Improve private sector tenants' knowledge of their rights to request energy saving measures, as they are often unaware of their legal rights.

  • The landlord must provide the EPC certificate. Since 1 October 2008 it has been a legal requirement to provide an EPC free of charge to new tenants under regulation 5 of The Energy Performance of Buildings (Certificates and Inspections) (England and Wales) Regulations 2007.


  • From April 2016 landlords in the private rented sector in England and Wales will not be able to refuse reasonable requests from their tenants to install energy efficiency measures. Guidance for tenants, landlords and others with an interest in private rented property is now available from the Department of Business, Energy and Industrial Strategy7


  • From April 2018, landlords in the private rented sector in England and Wales will not be allowed to let a property below EPC rating E. This will mean that properties in band F and G cannot be rented, although there will be exceptions, such as cases where the landlord cannot obtain planning consent or where all the cost effective measures that could be carried out at no upfront cost to the landlord have been completed8.


  • Generation Rent (formerly the National Private Tenants Organisation) encourages tenants to shop around for a better deal on their energy supply.


Provide advice, information, and referrals to other services for fuel poor households. Some examples of local authorities doing this this are listed below:

  • Huntingdonshire District Council runs free fuel poverty advice and information events for voluntary organisations and health and housing professionals. These events provide housing officers, environmental health officers, community support workers, health professionals, local housing associations, and others with the necessary tools and advice to help identify and assist vulnerable households who require support to increase the energy efficiency of their homes.


  • The Winter Survival Campaign in Liverpool was a drop-in event aimed at older people, providing information about how to keep warm and safe during the winter months, with a range of stakeholders from public bodies and non-governmental agencies.  This campaign also involved a number of roadshow events in various locations across the city, including health centres, GP surgeries and libraries.


  • Blackburn with Darwen’s DASH (Decent and Safe Homes) service provides advice on how to keep homes warm whilst keeping energy bills down. It also offers a free handyman service for residents aged over 60 or those getting disability living allowance. The Guidance for Living Over Winter (GLOW) scheme also refers people to DASH. Backed by the Council, NHS and voluntary organisations, it sees winter advice guidelines issued to anyone who knows, lives or works with older or vulnerable people and can get them extra help. 


  • The Warmer Worcestershire Partnership provides information through staff and volunteers who are already in contact with vulnerable residents and this has been key to reaching out to groups of residents. A staff member from the local energy advice service has also been placed on the mobile library service to reach those residents in rural communities who would get the most benefit from information and support services, but who do not travel to access services.


More detailed information for individuals is available from Home Heat Helpline or Fuel Poverty Action.


Raise awareness of national schemes and policies


Raise awareness of the financial support for fuel payments available. As at 2014:

  • Winter Fuel Payments are available for those over 62
  • Cold Weather Payments are made during periods of very cold weather to help people to pay for extra heating costs, and are available to those in receipt of certain benefits
  • Warm Home Discount Scheme  – participating energy companies provide a discount (£140 for winter 2014-15) on the electricity bills of certain customers.


Raise awareness of the grant schemes for improving energy efficiency

  • Energy Company Obligation (ECO) is an energy efficiency programme for both homeowners and people living in privately rented accommodation. Under the Energy Company Obligation (often simply called ECO), some low income households can get grants to cover the whole cost of cavity wall or loft insulation, and significant grants towards other improvements like new boilers. Other people are eligible for grants for cavity wall and loft insulation because they live in a particular location, known as a Carbon Saving Community area. Currently, everybody else can claim a grant towards the cost of cavity wall or loft insulation, or insulating a ‘hard-to-treat’ cavity wall.
  • Consideration should be given to how different households can make best use of the schemes on offer. Low income households are unlikely to be willing or able to take up Green Deal finance as they may be debt averse and/or already struggling to pay for household essentials such as energy bills. A loan may not be appropriate for these households and ECO funding would be preferable. Private rented sector tenants are also unlikely to take up Green Deal finance, although landlords can use it to improve their properties. From 2016 there will be regulations designed to encourage private rented sector tenants to request energy efficiency improvements from their landlords, and to oblige landlords to make improvements.9 ECO requires a survey to be undertaken on the property before measures are installed. There is usually a charge for this, which may be refunded when measures are installed, or provided free in the case of lower income households.


Raise awareness of the fuel poverty problem and available solutions among professionals


Work with Registered Social Landlords (RSLs) to support them in improving their properties and helping their fuel poor tenants. Local authorities can support RSLs in making sure the Decent Homes Standard is met and in accessing resources to further improve their properties. They can also help them to support their fuel poor tenants with advice and signposting to other schemes, for example, benefits checks.


Alert private landlords to the fact that the 2011 Energy Act provides for regulations to improve the energy efficiency performance of the private rented sector. From April 2016 landlords will not be able to refuse reasonable requests for consent to install Green Deal measures from the tenants. Subsequently, from April 2018, it will be illegal to rent out residential or business premises that do not reach a minimum energy efficiency standard (the standard is not set in the Act but it is expected to be EPC rating 'E').10


Some local authorities have produced advice for landlords in the private rented sector on fuel poverty:

  • Sheffield City Council provides advice on housing standards and how this relates to health hazards in private rented sector properties, including excess cold, for both landlords and tenants.
  • Royal Borough of Kensington and Chelsea similarly provides detailed advice on fuel poverty and energy efficiency in the private rented sector.


Landlord’s Energy Saving Allowance (LESA) was introduced to encourage landlords to improve the energy efficiency of let residential properties. It is an allowance for the cost of acquiring and installing certain energy-saving items.  The allowance is available on qualifying expenditure on specified energy saving items incurred before 6 April 2015.


Up-to-date information about available grants for improving energy efficiency can be found on the Energy Saving Trust website.


Back to the top


Actions to take


1. Review the recommended general actions


2. Explore sources of funding available to local authorities to tackle fuel poverty. Initiatives to tackle fuel poverty are likely to require specific funding, although the scale of this will depend on the type of initiative. For example, interest-free loans are available to councils through the DECC-administered Salix Energy Efficiency Lending Scheme. This can enable loan schemes such as that provided by The Stroud Target 2050 Loan scheme, which offers households the chance to borrow up to £10,000 to make energy-saving improvements to their homes, at interest rates that are significantly lower than commercial lenders. Local authorities should also take advantage of existing sources of help such as ECO.


3. Review and assess the energy efficiency standards of properties in your local area.  This can be accessed in bulk lots for a fee by contacting: epc.enquiry@communities.gsi.gov.uk. See Government guidance on accessing the data. This will help inform decisions on what to do for different housing tenures.


4. Continue investment in social housing improvement works. This is essential to help reduce fuel poverty and poor health among at risk groups, as social housing tenants are likely to be on low incomes and vulnerable to fuel poverty.1


5. Provide funding for improvements in the private rented sector. Below are two case studies of local authorities that have done this2:

  • Teignbridge District Council's Landlord Energy Assistance scheme provides grants to private sector landlords for measures that would improve the energy efficiency of a property occupied by a vulnerable tenant, such as those in receipt of a means tested benefit, aged 70 years or over, or with a child aged under six.
  • The North Staffordshire Landlord Accreditation scheme is a partnership between Staffordshire Moorlands District Council, Stoke-on-Trent City Council, Newcastle-under-Lyme Borough Council, Stafford Borough Council and the North Staffordshire Landlords Association and, amongst other benefits to landlords, provides a grant of up to £2,000 for energy efficiency improvements.


6. Consider leveraging contributions from developers to support action on fuel poverty, as illustrated in the case studies below:

  • Waveney District Council used a portion of its section 106 funding from developers to help bring empty properties in the area back into use and up to good, safe modern standards by removing hazards, including those that lead to cold homes. Funding was provided to the property owner in exchange for them agreeing to house council-nominated tenants from the housing waiting list.
  • Islington Council has created a carbon offset fund to pay for energy-saving work on social housing in the borough3. If developments are not carbon neutral they will have to offset the carbon dioxide emissions that will be caused by their project by paying into the carbon offset fund. There is flexibility to waive or reduce the charge for smaller projects or other schemes whose viability would be threatened by the charge. 


7. Enforce private rented sector standards. Local authorities already have a legal duty to take ‘appropriate action’ wherever a property is found to have a ‘Category 1 hazard’ (the most serious hazard, e.g. no fire alarm, inadequate heating) under the Housing Health and Safety Rating System (HHSRS). Increasing awareness of standards is only the first stage; local authorities must also enforce these standards. The usual course of action is generally to first work with landlords, to encourage them to install the necessary improvements, before resorting to formal action.  Local authorities can force uncooperative landlords to install adequate thermal insulation and a suitable and effective means of space heating so that the home can be economically maintained at reasonable temperatures.


8. Make greater use of selective licensing powers and introduce landlord accreditation schemes.  The introduction of a selective licensing scheme should only be considered as an integral part of a local authority’s overall housing strategy. Sufficient resources must be made available to support private landlords and tenants to comply with any obligations placed upon them as part of the scheme.  Shelter has produced a good practice guide for local authorities on selective licensing.


9. Use the private rented sector to tackle homelessness and improve housing standards at the same time. The Localism Act 2011 has increased the potential for local authorities to use the private rented sector to tackle homelessness as part of their obligations under the Homelessness Act 2002.  By paying to house homeless people in the private rented sector, local authorities have some leverage with landlords to encourage them to improve their properties. However, if homeless people are housed in substandard homes then they are likely to become fuel poor.


10. Ensure the energy efficiency of new build.  Many councils including Leicester City Council and Ipswich Borough Council are working with developers to ensure that new developments exceed the minimum standards of energy efficiency.4


11. Make use of new technological developments such as smart meters, and support their roll out and use in encouraging energy saving behaviours.  Innovative technology could prove useful in tacking fuel poverty, either through the information the meters provide or when a visit is made to the property to install a meter, which provides an opportunity to provide advice to the household or assess the energy efficiency of the property.


12. Apply area-based initiatives to tackle fuel poverty. Target home owners and renters alike, to bring tangible benefits in terms of tackling fuel poverty and reducing carbon emissions. Examples of this include initiatives from the Nottingham Energy Partnership such as the Greater Nottingham Healthy Housing Service and an older project, Aspley Super Warm Zone which used CESP funding (this source of funding finished in December 2012).


13. Support income maximisation schemes to reduce fuel poverty. People often do not claim all of the benefits that they are entitled to, so benefits checks can increase people's incomes and thereby reduce the depth of fuel poverty. Islington's SHINE (Seasonal Health Intervention Network) initiative includes a referral system where one referral can lead to up to thirty potential interventions, including benefits checks and energy advice. The SHINE initiative also prioritises vulnerable occupants, including those found to be living with long-term health conditions. See the SHINE Case Study.


14. Organise help for vulnerable households during cold weather periods.

  • Work in partnership with public health and health providers to tackle cold homes. The Cold Weather Plan for England is a good practice guide produced by Public Health England, supported by the Local Government Association, which aims to inform relevant stakeholders of the complex factors that create cold homes and encourage appropriate action to address them.
  • Work with charities, non-governmental organisations and groups of volunteers to assist vulnerable individuals during cold periods. See the Snow Angels Case Study.


Back to the top


On this page:


Tools


Name

Developer/ Author

Type of Resource

Finding the Fuel Poor

Fuel Poverty – Energy Statistics (Low Income High Cost Indicator up to 2012, 10% indicator up to 2011)

DECC

Interactive map

Accessing register data under the EnergyPerformance of Buildings. This shows the SAP ratings and other information for all buildings which have had Energy Performance Certificates lodged.

DCLG

Regulations for accessing EPC data in bulk


Resources


Name

Developer / Author

Type of Resource

Government legislation

Warm Homes and Energy Conservation Act

Gov.uk

Legislation Document

Personal information (section 40 and regulation 13) Freedom of Information Act Environmental information Regulations

Information Commissioner’s Office

Legislation Document

Private rented sector energy efficiency regulations (Domestic)

DECC

Regulation 

Government Data Sources

Warm Homes and Energy Conservation Act 2000


Gov.uk

Legislation Document

Fuel poverty detailed tables for 10% indicator (2011)


DECC

Data tables

Fuel poverty detailed tables for LIHC indicator (2013)


DECC

Data tables

Fuel poverty methodology handbook

DECC

Methodology for producing fuel poverty statistics

Census 2001 dataset KS18

ONS

Census data

Census 2011 dataset KS402EW

ONS

Census data

English Housing Survey, 2013: Housing Stock Data. (2015)

DCLG

Data (UK Data Service. SN: 7802.)

Fuel Poverty: Households (%) in fuel poverty 2006-11

DECC

Interactive map

Winter Fuel Payment

Gov.uk

Government Guide

Met Office climate data

Met Office

Data


Useful Links for organisations that work to tackle fuel poverty

National Energy Action


Charity

Home Heat Helpline


Advice Line

Energy Savings Trust


Advice Charity

Citizens Advice


Advice Charity

Right to Fuel


Campaign Body

Energy Bill Revolution


Campaign

Turn 2 Us


Grant Funding Body

How To Improve Health And Wellbeing Through Action On Affordable Warmth

UK Health Forum

Guidance

Recommendations on how to reduce the risk of death and ill health associated with living in a cold home

National Institute for Clinical Excellence (NICE)

Guidance


Government assistance on fuel poverty

Winter fuel payment

Government

Website guidance

Cold weather payment

Government

Website guidance

The warm home discount scheme

Government

Website guidance


Other guidance on fuel poverty assistance

Funding and grants

CSE

Website advice

Tackling fuel poverty through local leadership


Local Government association

Advice sheet


Information about the health impacts of living in cold homes

The Health Impacts of Cold Homes and Fuel Poverty

Marmot Review Team

Report for Friends of the Earth


Government Reports on Fuel Poverty

Getting the measure of fuel poverty. CASE report 72

CASE for DECC

Report

Cutting the cost of keeping warm: a new fuel poverty strategy for England (March 2015)

DECC

Report

Latest English (and UK) fuel poverty statistics

DECC

Statistics

Latest Scottish report on fuel poverty nationally

The Scottish Government

Report

Local authority-level fuel poverty statistics for Scotland

The Scottish Government

Statistics

Welsh fuel poverty projections

The Welsh Government

Statistics

LIHC Report (full report, summaries, and data available)

DECC

Report

Cutting the cost of keeping warm: A new fuel poverty strategy for England

DECC

Report


Other Government documents

English Housing Survey Headline Report 2013-14

DCLG

Survey report

Decent Homes: refurbishing social housing

DCLG The Rt Hon Eric Pickles MPMinister of State for Housing and HCA

Policy detail

Fuel Poverty in the Private Rented and Off-Grid Sectors

National Private Tenants Organisation (FP 10)

Memo

2009, Chief Medical Officer, Annual Report

Department of Health

Report

The causes and effects of fuel poverty

DTI

Report chapter

Investigation into Overheating in Homes: Literature review

DCLG

Report

Health and Safety Rating System

DCLG

Guidance

Warm and Healthy Homes

LGG: Environment and Housing

Report


Non-governmental reports on fuel poverty

Disability poverty in the UK

Leonard Cheshire Disability

Report

Fuel poverty and disability

Not available online; contact Leonard Cheshire Disability

Leonard Cheshire Disability

Report

Fuel poverty and disability: a statistical analysis of the English Housing Survey

Department of Social Policy and Social Work, The University of York

Report

In the Balance: Disabled people’s experiences of debt

Not available online; contact Leonard Cheshire Disability

Leonard Cheshire Disability

Report

Fuel Poverty: 2014 Update

Energy Bill Revolution for the Association for the Conservation of Energy

Update Report

The plight of low income families and young people living in fuel poverty

Barnado’s

Report

Fact file: Families and fuel poverty (10% definition used)

ACE and EBR

Report

Time to reconsider UK energy and fuel poverty policies?

Joseph Rowntree Foundation

Report paper

A minimum energy efficiency standard for private rented properties

Multiple charities and organisations

Joint statement

You just have to get by: Coping with low incomes and cold

CSE team: Anderson, White and Finney. For the eaga Charitable Trust

Report

A British Property Federation Guide to Energy Efficiency and the Private Rented Sector

British Property Federation

Report

Fuel Poverty: How to improve health and wellbeing through action on affordable warmth

Jo Butcher, UK Health Forum

Report

Excess winter deaths and morbidity and the health risks associated with cold homes

National Institute for Health and Care Excellence

Public Health draft guideline

The health impacts of cold homes and fuel poverty

Marmot Review Team

Report

Distribution of carbon emissions in the UK: implications for domestic energy policy

CSE for JRF

Report

Tackling fuel poverty during the transition to a low-carbon economy

Ekins, P. & Lockwood, M. For JRF

Report

Freedom from Fuel Poverty

CSE

Report

Health and fuel poverty – a review of literature

CSE

Report

Private tenants are trapped into higher fuel bills

Citizens Advice

News article

Shop around: How renters can save on their energy bills

Generation rent

Website blog


Personal accounts and case studies


Name

Developer / Author

Type of Resource

Personal accounts on the reality of living in fuel poverty

Fuel poverty and disability

Disability Action

Briefing Paper

Fuel poverty: 'There comes a point where you can't put more clothes on'


The Guardian

Online Article

Leading the way in eradicating fuel poverty


Centre for Sustainable Energy

Video

Fuel poverty in rural England

Age UK

Audio File


Case studies

Salford's Affordable Warmth Scheme aimed to raise awareness of the energy-efficiency help, such as Warm Front grants, available to local people and they did this by making presentations at pension’s lunch clubs, placing local newsletter adverts and working with a local service provider to Black and Minority Salford communities.


The Warmer Worcestershire Project aims to promote energy efficiency and help local residents save money on fuel bills. It started with a thermal image survey of Worcester to illustrate the heat loss from property roofs.


Blackpool City Council ran a pilot project with NHS Blackpool that used their flu vaccine mailing lists to inform people about the options available to them.


Huntingdonshire District Council is working with the BRE on the Green House project to develop whole-house refurbishment strategies which result in houses which are more efficient, healthier and cheaper to run. The team has recruited industry partners and aims to use two refurbished properties as educational resources for homeowners, housing providers, tradespeople, suppliers and educational institutions.


DASH (Decent and Safe Homes) service is an initiative run between property owners, landlords and tenants and aims to improve housing conditions in the private sector with a  focus on private rented housing. Referrals were also made to DASH by the Guidance for Living Over Winter (GLOW) scheme which was backed by the Council, NHS and voluntary organisations.


Teignbridge District Council's Landlord Energy Assistance scheme provides advice to landlords on grants for energy efficiency measures.


The North (and Central) Staffordshire Landlord Accreditation scheme aims to improve standards.


Waveney District Council


Greater Nottingham Healthy Housing Service


Aspley Super Warm Zone was one of the UK Government’s 100 pilot CESP schemes. It was a two year programme that delivered whole-house refurbishments focussing primarily on solid wall insulation.


Islington's SHINE scheme stands for Seasonal Health Intervention Network and is a one-stop referral system working in collaboration with other community groups and advice teams. Those who are considered to be vulnerable or have long-term illnesses are prioritised.


Islington planning and building control


Snow Angels is the result of a partnership between organisations involved in health, housing, environmental & emergency planning and the local community to provide community-based responses to extreme cold weather in a rural area.


Fuel Poverty and Warm Homes: A Strategy for Liverpool

Liverpool LA

Report

Stroud Target 2050 loan

Stroud LA

Booklet


Government advice for landlords

PIM2072 – Deductions: General rules: Main types of expenses: Landlord’s Energy Savings Allowance (LESA)

Advice


Landlord advice

Private sector housing and landlord advice

Sheffield

Website advice

Energy Efficiency, Fuel Poverty and Environmental Health: Information and advice for private sector landlords

The Royal Borough of Kensington and Chelsea

Guidance report

Home Heat Helpline

Energy UK

Helpline

Fuel Poverty Action


Website


Back to the top