Some low income households are subject to a triple injustice


Victorian terraced housing © Climate UK


On this page:


  1. While they only make a relatively small contribution to carbon emissions, some low income households are subject to a triple injustice: they pay disproportionately for the policies to mitigate carbon emissions, and benefit less from those policies than higher income households.  A number of carbon mitigation policies are funded through energy bills, and energy costs take a larger proportion of low income households’ income, relative to higher income households. Fuel poverty policy is closely linked to carbon mitigation policy, as both objectives are served by improved home energy efficiency, and in recent years fuel poverty policy has also been partly funded through energy bills. The low income households that do not receive energy efficiency or heating measures from fuel poverty policy are therefore paying for the policy while not receiving any benefit.
  2. As well as low income households generally, there is a wider set of disadvantaged groups that can be described as ‘energy vulnerable’, who may struggle to pay their energy bills, potentially due to high energy needs as well as poverty. Poverty can be defined as a lack of sufficient resources to meet minimum material and social needs1. For example, housebound elderly or disabled people require more energy at home than working couples with no children because they spend much more time at home and require a higher living temperature to remain healthy, and they may also need medical equipment which uses electricity. Ofgem’s Consumer Vulnerability Strategy defines vulnerability as the situation where a consumer’s personal circumstances and characteristics combine with aspects of the market to create situations where he or she is: significantly less able than a typical consumer to protect or represent his or her interests in the energy market; and/or significantly more likely than a typical consumer to suffer detriment, or that detriment is likely to be more substantial2. Here were have labelled this energy vulnerability. Energy vulnerability may encompass a wider set of households than those in fuel poverty (Box 1.1). See also Who is affected by fuel poverty?)


Box 1.1: Energy vulnerability


Energy vulnerability can be defined as a situation where a household has high energy needs relative to its ability to pay for energy.


High energy needs could be caused by the following factors:


  • living in a rural area and off the gas grid
  • living in private rented accommodation
  • living in a cold, inefficient home
  • having a long-term illness or disability, or being elderly (and so requiring a higher living temperature and spending a lot of time at home)
  • requiring medical equipment powered by electricity
  • living alone.


Ability to pay for energy could be influenced by the following factors:


  • factors which limit a household's ability to get the best tariff for them:

  • not having internet access
  • having debt over £500 on a prepayment meter
  • not speaking English as a first language


  • being on a low income, including for the following reasons:

  • being unemployed or being made redundant
  • being a full-time carer
  • being a lone parent
  • being retired


  • being inexperienced in dealing with bills, for example due to:

  • leaving care for the first time
  • the death of a partner who always dealt with the bills
  • having difficulty coping with day to day life, for example due to:
  • experiencing relationship breakdown
  • experiencing bereavement


(Most of these factors are from Ofgem’s Consumer Vulnerability Strategy, pp15-16)


  1. It is important to reduce carbon emissions from energy use in the housing stock as part of efforts to avoid dangerous climate change; however, funding some of these policies through household energy bills is problematic for low income households3. Policies include measures to improve the thermal efficiency of dwellings (e.g. the Energy Company Obligation and the Green Deal) and to promote low carbon generation (e.g. the Feed-In Tariff, the Renewable Heat Incentive).  Some policies are funded through energy bills (e.g. the Energy Company Obligation, the Feed-In Tariff), some are funded through taxation (e.g. the Renewable Heat Incentive), and the Green Deal is a loan or pay as you save scheme. Some policies are specifically targeted at low income households, for example the Warm Home Discount, while others have different objectives, such as funding infrastructure change (see box 1.2 for more information).


Box 1.2: Carbon reduction and fuel poverty policies in Britain, purpose and funding sources

Policy, purpose, duration

Nation

Timescale

Fuel type subject to costs

Funding source

Funding (note different timescales)

ECO Carbon Emissions Reduction Obligation (CERO)

Provides carbon reduction measures to households

GB

2013-2017 (from 2017 ECO will be replaced with a new domestic energy efficiency supplier obligation which will run until 2022)


Electricity & gas


Energy bills


Estimated at £1.3 billion per year in Government impact assessment.

Scheme cost £1.4 billion in 2013, £1 billion in 2014 and £0.3 billion in 2015. Phase three of the scheme from April 2017 is expected to cost £640 million per year, rising with inflation.

ECO Home Heating Cost Reduction Obligation (HHCRO)

Provides heating cost reduction measures to households

GB

Electricity & gas

ECO Carbon Saving Communities Obligation (CSCO)

Provides carbon reduction measures to lowest income 15% of LSOAs

GB

Electricity & gas

Contracts for Difference

Encourages support for larger scale low carbon technology

GB

Round 1 - 2015

Round 2 - 2016

Electricity


Round 1 2.1GW of capacity has been procured at a cost of £3.15 billion.

Feed-In Tariff

Supports small scale renewable electricity

GB

Ongoing (new tariffs introduced 2016 and mapped to continue to 2018/19 when measures will be either revisited or removed completely)

Electricity

Energy bills

£100m cap on annual spending until the end of 2018/19

Warm Home Discount

Direct and indirect support to fuel poor customers, including fuel bill rebate

GB

Current scheme 2015/16

Will continue to 2020/2021

Electricity & gas

Energy bills

££320 million in 2015/6

£320 million up to 2020/21 rising with inflation


Smart meters

Installation of smart meters in all homes and businesses

GB

To 2020

Electricity & gas

Energy bills, but net benefit expected

Net benefit of £6.2 billion expected over the period to 2030. Year by year balance of costs and benefits unknown.

Domestic Renewable Heat Incentive

Supports installation of renewable heat technology in households

GB

Ongoing

Amendments from 24th March 2016

n/a

Taxation

Spending on the RHI is expected to rise from £430m in 2015/16 to £1.15bn in 2020/21

Green Deal

Supports installation of energy efficiency measures and low carbon heating. Previously, the Green Deal Finance Company provided finance to Green Deal providers to enable them to give out Green Deal loans.

GB, (and Northern Ireland has its own Green Deal)

In July 2015, the Green Deal finance company ceased to offer new loans. Any loans which have already been issued are not affected (although the Green Deal Finance Company have announced they are considering selling off their loan book)

The Green Deal Assessment framework is still open and it is still possible to get a Green Deal loan from a private company.

n/a (although for the individual household with a Green Deal loan pays via the electricity meter)

Households receiving measures pay for them using a loan.

n/a  - funded by households receiving measures

Green Deal Home Improvement Fund

Discount on Green Deal measures

GB

Funding through the Green Deal Home Improvement Fund ceased in September 2015. Existing applications and vouchers will not be affected. Those customers who already have a voucher must redeem it before its expiry date.

n/a

Taxation

£70 million of funding given out in third release of funding in March 2015

Green Deal Communities

Funding for a few local authorities to support area-based delivery of Green Deal plans and ECO

GB

No further schemes receiving funding. In communities where funding is already allocated measures are still being installed. Householders had until March 2016 to place an order with a Green Deal installer and works finished by 30th June 2016.

n/a

Taxation

£19.5 million in 2014

Welsh Government Warm Homes NEST

Energy efficiency improvements for homes with low energy efficiency rating

Wales

Ongoing (annual funding could vary)

n/a

Welsh government

£18m in 2014-15


Also leverages other funding such as ECO (£1.3 million in 214-2015)


Welsh Government Warm Homes Arbed

Energy efficiency improvements for homes

Wales

Phase 2 from May 2012 and ongoing

n/a

European Regional Development Fund

£33m over 3.5 years

Welsh government

£12m over 3.5 years

Also leverages ECO money


Home Energy Efficiency Programmes for Scotland: Area Based Schemes

Funding to local authorities to support area-based delivery of energy efficiency improvements

Scotland

Ongoing: likely to be at least until the end of ECO (annual funding could vary)

n/a

Scottish government

£65 million for 2015-16

Also leverages ECO money

Target of levering £120m a year.

Home Energy Efficiency Programmes for Scotland: Warmer Homes Scotland

Funding for energy efficiency measures for home owners or tenants of private landlords who have lived in their home for at least 6 months, and who are on a low income.

Scotland

Launched in 2015 (replacing the Energy Assistance Scheme). To continue for up to 7 years.

n/a

Scottish government


Budget for year 1 of £16m.

Winter Fuel Payment

Annual payment to all people of pensionable age. Not means tested, and therefore a poorly targeted way of trying to address fuel poverty.

GB (and Northern Ireland administers its own version). Those living abroad can still claim (although from autumn 2015 a temperature test is applied so those resident in warm countries do not receive the payment)

Ongoing

n/a

Taxation

£2.1 billion in winter 2014/15, plus £24.52 million payments to people living outside of the UK

Cold Weather Payment

Made to those in receipt of certain benefits at times of very cold weather

GB

Ongoing

n/a

Taxation, from Social Fund

Total of £11m in winter 2014/15 (across 11,200 payments)

EU Emissions Trading Scheme and Carbon Price Floor  Carbon taxes on fuel use(affects electricity generation)

EU / GB

Until at least 2020

Electricity

Paid by generators of electricity and so electricity price is affected.

£6.867 million in 2020 (cost to domestic consumers, estimated by modelling), less before 2020.


  • Other policies which have costs to domestic consumers which are not detailed here are nuclear decommissioning and Electricity Market Reform, which among other things will phase out the Renewables Obligation.


  • Information in this table shows most recent data available at February 2015.


  1. There is an unequal distribution of responsibility for emissions, with affluent households in Britain being responsible for a higher proportion of total emissions related to housing and transport than lower income households. Figure 1.1 shows all direct household emissions by income decile and illustrates that the current distribution of household emissions is strongly correlated with household income ie higher income households are responsible for more emissions. Figure 1.2shows the proportion of each source’s emissions and responsibility for these emissions by income decile. For household fuels (covering both heat and power in the home), the richest income decile is responsible for twice as much carbon dioxide as the poorest income decile, and for all emissions categories considered together (household fuels and all types of transport) the richest decile is responsible for 16% of total emissions, more than three times as much as the poorest decile at 5%.


Figure 1.1: Mean annual household CO2 emissions from all sources by disposable household income decile (GB EFS dataset)7


Figure 1.2: Proportion of household CO2 emissions attributed to each disposable income decile by emissions source, for Great Britain8


  1. Looking at the wider picture across all sources of direct and indirect carbon emissions, it is also true that lower income households are responsible for fewer emissions from other forms of consumption than higher income households.  As well as direct emissions from home heating and transport, there are indirect emissions from consumption of goods and services (including from shopping and leisure activities). Both direct and indirect emissions rise with income9.  However it is household energy bills where policy costs can fall disproportionately on the energy vulnerable.
  2. Although the richest use more energy and emit more carbon, energy bills typically represent a higher proportion of income for lower income households than those on higher incomes10, and so relative to ability to pay, low income households are also contributing more to energy bill-funded policies. In 2012, the poorest fifth of households spent 11% of their income on household energy; more than double the UK average of 5%11
  3. Low income households have fewer options to reduce their energy use without reducing their standard of living. Low income households have a more limited choice of housing and cannot fund energy efficiency improvements to their homes themselves. Forty-two percent of households below average income live in social housing, while 37% live in private rented sector housing12.  Although social housing often has a high level of energy efficiency, much of the private rented sector housing stock has low energy efficiency. Reducing energy costs through improved energy efficiency is not an option for some low income households. In addition, some people, such as older people and people with a disability or long term illness, are particularly affected because they spend more time at home and require a higher living temperature, and therefore use more energy.
  4. Lower income households may pay more per unit for their energy. The poverty premium, whereby some consumers pay more for goods and services due to their position in the market, is well documented13. Those using prepayment meters have access to a limited range of tariffs, as do households without internet access, meaning they cannot access the cheapest tariff available14. They may also be prevented from switching if they are in arrears. In addition, many tariffs are two-tiered, with the price per unit becoming cheaper above a specified level of consumption, which means that low users pay more on average per unit.
  5. Funding carbon mitigation and fuel poverty policies through taxation would be fairer, as income tax is paid proportional to income. The current system of paying for some policies through increasing the cost of household essentials is disproportionately tough on those who struggle to afford these essentials. In contrast, income tax is paid proportional to earnings, and so those who are more able to pay contribute more.
  6. Carbon mitigation and fuel poverty policies provide benefits to some households, for example as free or discounted insulation and heating, or funding for a solar panel, but not all households benefit equally. Whether an individual household benefits depends on the design of the policy, its targets, and how it is implemented in practice. For example, in the case of the Energy Company Obligation, factors influencing distribution of benefits include whether: the property is suitable for measures covered by the policy; the household has certain characteristics such as receiving eligible state benefits; the policy has been advertised in the local area; the household trusts the company offering the measures, and how many measures the energy company plans to fund nation-wide. For the Feed-In Tariff, whether a household benefits would depend on factors including whether a household has sufficient savings to cover the upfront costs of a solar PV installation (or other qualifying technology), or if not, whether they are willing to enter into an agreement with a company which will finance the upfront costs in return for some of the benefits. Alternatively, households in rented accommodation can benefit if their landlord wants to install a technology funded by the Feed-In Tariff (this is most common in social housing). A 2013 study which modelled the impact of energy and carbon policies on annual household energy bills in England in 2020 found that the poorest 10% of households will see a reduction of 7% on the average energy bill, while the richest 10% of households will see an average reduction of 12%15. This is illustrated in Figure 1.3 below.


Figure 1.3: Impact of policies on actual household energy bills in 2020 by disposable income decile (England)16


  1. Even fuel poverty policies can be unfair for low income households which are contributing to the cost through their energy bills but not receiving the benefits. The current national policy for fuel poverty, the Home Heating Cost Reduction Obligation (HHCRO), part of the Energy Company Obligation, aims to install measures in low income households to reduce heating costs, but while all households pay for this through their energy bills, only some low income households receive the benefits. The households that receive the benefits may be taken out of fuel poverty, but this is at the cost of making energy more expensive for all low income households. In addition, households that receive benefits early in the lifetime of the policy have to pay less towards the policy than those who receive benefits later. Scotland and Wales have taxpayer-funded fuel poverty schemes in addition to HHCRO, but England does not.
  2. Energy costs have increased in recent years, and although energy policies are only a small part of this increase, their impact on low income households is substantial. The average bill for electricity and gas combined in the UK more than doubled between 1996 and 2014, from approximately £600 to just under £1,350 (Figure 1.4). 2015 saw a slight reduction in the average bill to £1,300, predominantly a result of small reductions by the Big Six energy companies in that year.


Figure 1.4: Average annual domestic electricity and gas bills for England and Wales from 1996 to 2015, based on standard credit payment prices (nominal prices)17


  1. The most significant factor affecting the long term trend of an increase in energy bills is the rise in price of wholesale gas.18 The components which Ofgem estimate make up the average gas and electricity bill in 2015 are shown in Figure 1.5. Although this shows average bills, the proportions of each element will be the same whatever the overall bill. For gas, wholesale costs make up the largest proportion of the cost at 46%, followed by network costs at 21% and operating costs at 13%. The cost of energy and climate change policies is 3% of the cost, less than the cost of VAT. For electricity, wholesale costs make up 37% of the bill, with network costs taking 24% of the bill, and operating costs also making up 13% of the cost. There are more policy costs on electricity bills, as some policies only affect electricity. These are the Renewables Obligation, Feed-In Tariffs, the EU Emissions Trading Scheme and the Carbon Price Floor (these last two are effectively carbon taxes).


Figure 1.5: Estimated breakdown of average household gas and electricity bills in April 2015 to March 2016 (based on estimates made by Ofgem for a typical larger supplier)16


  1. The costs of policy measures funded through bills tend to disproportionately hit households that rely on electricity to heat their homes. Energy and climate change policies account for 12% of a typical electricity bill – almost three times as much as on a typical gas bill. Overall, for a dual fuel customer, energy and climate change costs represent only an estimated 7% of a total fuel bill, but this equates to roughly £94 a year20, which is a significant additional cost to a low income household.
  2. Increases in energy prices represent a proportionally greater financial burden for those on low incomes compared to more affluent households.  The cost of fuel is only one component of total household expenditure, but as the price of fuel more than doubled between 2002 and 2012 the impact of higher bills is a significant factor affecting household incomes and contributing to poverty. The Joseph Rowntree Foundation's Minimum Income Standard research found that the cost of a minimum basket of goods and services has typically risen by between a quarter and just over a third between 2008 and 2014, and that the rising cost of energy played an important part in that, rising by 45% in that time21.


Back to the top

References

  1. JRF’s definition of poverty: ‘When a person’s resources (mainly their material resources) are not sufficient to meet their minimum needs (including social participation).’ 
  2. Ofgem (2013) Consumer Vulnerability Strategy
  3. DECC (2015) 2014 UK Greenhouse Gas Emissions, Provisional Figures
  4. Preston, I., White, V., Thumim, J., Bridgeman, T., and Brand, C (2013) Distribution of Carbon Emissions in the UK: Implications for Domestic Energy Policy, p.38
  5. Preston, I., White, V., Thumim, J., Bridgeman, T., and Brand, C (2013) Distribution of Carbon Emissions in the UK: Implications for Domestic Energy Policy, p.8
  6. See for example, Gough, Ian, Abdallah, Saamah, Johnson, Viki, Ryan-Collins, Josh and Smith, Cindy (2011) The distribution of total embodied greenhouse gas emissions by households in the UK, and some implications for social policy. CASEpapers, CASE/152. Centre for Analysis of Social Exclusion, London School of Economics and Political Science, London, UK
  7. JRF (2013) Monitoring poverty and social exclusion 2013
  8. Office for National Statistics (2014) 5 facts about household energy spending in the UK, 2002-2012
  9. JRF (2014) Poverty after housing costs by housing tenure
  10. See for example Hirsch, D. (2013) Addressing the Poverty Premium: Approaches to regulation
  11. Preston, I., White, V., Blacklaws, K. , Hirsch, D. (2014) Fuel and poverty: A Rapid Evidence Assessment for the Joseph Rowntree Foundation
  12. Preston, I., White, V., Thumim, J., Bridgeman, T., and Brand, C (2013) Distribution of Carbon Emissions in the UK: Implications for Domestic Energy Policy, p.45 NB. The assumptions about some policies and costs in this study are different from those shown in Box 2.
  13. Preston, I., White, V., Thumim, J., Bridgeman, T., and Brand, C (2013) Distribution of Carbon Emissions in the UK: Implications for Domestic Energy Policy, p.53
  14. DECC(2015), Average annual domestic electricity bills by home and non-home supplier
  15. Committee on Climate Change (2012) Energy prices and bills - impacts of meeting carbon budgets
  16. Ofgem (2015) Charts: Outlook for costs that make up energy bills 
  17. Davies, A., Hirsch, D., and Padley, M. (2014) A minimum income standard for the UK in 2014, Joseph Rowntree Foundation 

Climate change mitigation policies are essential to avoid dangerous climate change


 Solar PV panels on social housing for older people © Climate UK 


  1. Climate change mitigation policies are essential to avoid dangerous climate change. The UK needs climate change mitigation policies, but they should avoid penalising people on low incomes who are least responsible for carbon emissions from energy use.
  2. Although the main carbon mitigation and fuel poverty policies for the energy sector are set at national level, there are many local opportunities to reduce the triple injustice by supporting community approaches to reducing energy vulnerability and fuel poverty. Local government and partner agencies, including registered social landlords, have local knowledge on the needs of local people, the location of more deprived communities and the condition of their housing stock, enabling some consideration of equity issues in the delivery of local interventions, notwithstanding the constraints of national policy.
  3. The links between carbon reduction, home energy efficiency, public health and poverty reduction mean that there are opportunities for triple wins in delivery at local level. Home energy efficiency measures can reduce carbon emissions, improve people’s health (conditions such as arthritis and asthma are worsened in cold, damp homes) and reduce fuel bills. There are opportunities to tackle multiple agendas simultaneously by delivering coordinated local solutions. Local authorities and their partners have the opportunity to better join up services to address local needs, for example, to address public health by working with health services to refer people with respiratory diseases to household energy efficiency schemes. Housing providers can also consider how asset management strategies can be used to drive up standards for fuel poor or energy vulnerable households.
  4. There are national policies which can support a local drive for action to promote energy justice relating to both community energy and fuel poverty.
  • The Community Energy Strategy, published in January 2014, describes how government will support community energy in the UK. It sets out actions under the categories of creating partnerships, building capability and capacity, measuring impact, and supporting communities to produce, reduce, manage and purchase energy.
  • The Government’s new fuel poverty strategy, Cutting the cost of keeping warm has a target to ensure that as many fuel poor homes as is reasonably practicable achieve a minimum energy efficiency standard of band C, by 20301. (The target applies to England only, as fuel poverty is a devolved responsibility and the devolved nations are responsible for setting their own targets). The target is part of a new fuel poverty strategy and is accompanied by a suggested road map of actions to 2030. For more information on how local action can promote energy justice, see sections 4 and 5 of this message and sections 4 and 5 of the fuel poverty section.
  1. Local authorities and their partners can work together to create fairer conditions for people in their locality through supporting local community energy initiatives. Community energy projects cover a wide range of initiatives, most commonly energy efficiency (including both behaviour change and installation of measures) and energy generation. The Community Energy Strategy says “Community-led action can produce energy, reduce energy use, manage energy demand and purchase energy. It can often tackle challenges more effectively than government alone, developing solutions to meet local needs, and involving local people2. Community energy initiatives can be local-authority led, or (more commonly) community or voluntary sector-led. In the case of community or voluntary sector-led projects, support from local authorities and other local organisations can help groups to achieve more.


Addressing energy injustice


Insulation retrofit to tower block © Climate UK

On this page


Addressing energy injustice


  1. To address energy injustice it can be helpful to consider the location not only of fuel poor households, but also those who are energy vulnerable for other reasons, and the relationship between their location and the delivery of interventions. A question for local action may be to consider where there is a mismatch between community needs and delivery of actions to tackle the problems. Looking at how emissions vary may also be informative in relation to where carbon reduction is most needed and considering how fuel poverty and carbon reduction strategies can come together.


Locating fuel poor and energy vulnerable households


  1. Fuel poor households are the most likely to be experiencing the triple injustice; fuel poverty is determined by household income and fuel costs, and is higher in rural and off-gas areas. Within England, the West Midlands has the highest proportion of its households living in fuel poverty (around 14%), while the South East has the lowest proportion (around 8%) (Figure 3.1).  The region with the greatest proportion of all of England’s fuel poor households is the North West at over 14%. More information can be found in the fuel poverty section on who is fuel poor, and maps of fuel poverty, based on DECC statistics which can also be downloaded from the map tool.


Figure 3.1: Percentage of households in fuel poverty by region, DECC statistics1


  1. Low income is an important factor in identifying those households which may suffer the triple injustice, and areas of low income can be identified using geographic datasets. The English, Welsh and Scottish indices of multiple deprivation each have an income domain, and using these, neighbourhoods which have high numbers of low income households can be located2. The map tool provides maps of small area estimates of low income households in England using data from the Office for National Statistics.
  2. Tenure is also an important factor, with households in privately rented accommodation more likely to have homes which are energy inefficient, compared to social rented housing. Census datasets can be used to identify areas with the highest proportions of privately rented accommodation. Local authorities and social landlords may have an understanding of their local areas that is more detailed than the information given by the Census datasets. In particular they will know where social housing is concentrated and whether the social housing has high energy efficiency standards; if it does, those suffering the triple injustice are more likely to be found in areas of low income where there is little social housing.
  3. Those who heat their homes using electricity have high heating costs and have more policy costs loaded onto their bills.  The majority of households that use electricity to heat their homes are located in off-gas areas or urban flats. These kinds of households could benefit from renewable or low carbon heating, such as biomass for off-gas areas and air source heat pumps or district heating for urban flats.


Differences in emissions by location


  1. There are differences in average household carbon emissions between urban, town and rural areas, with emissions being highest in rural areas and lowest in urban areas. Figure 3.2 shows the difference in average household carbon emissions between urban, town and rural areas. While there is a notable increase in emissions as the level of rurality increases, the difference is modest compared to the effect of income (see section 1). Across all emissions sources shown in the figure, on average rural households have carbon emissions that are one fifth higher than those found in urban areas. When looking at heating fuels only, villages and hamlets have 25% higher emissions from household fuels than urban dwellings. Factors influencing this include a lack of access to gas in many rural areas, leading to greater use of carbon intensive oil, and a greater proportion of rural homes being large, with solid walls, requiring more heating than small, well insulated urban dwellings.


Figure 3.2: Mean annual household CO2 emissions from all sources by settlement type (EFS dataset, England and Wales only)3


  1. There is little variation in average carbon emissions from heating fuels on a regional basis, although there is more variation when emissions from transport are included. Emissions by region, together with average incomes, are shown in Figure 3.3. London has the lowest average household fuel emissions of any region, due to a higher proportion of smaller dwellings and a high level of access to the gas network. When carbon emissions from transport are also taken into account, there is more variation in emissions across the regions, loosely linked to average income, apart from in London where lower car use and greater availability of public transport bring total emissions down despite high average income (which hides extremes of wealth and poverty). This is the main reason why the higher than average income does not correlate with higher emissions in London as it does in all other regions. Eastern England has the highest overall emissions, as well as the highest emissions from household fuel. Excluding London due to its atypical characteristics, the North East of England has the lowest overall emissions, which is once again in keeping with having the lowest emissions from household fuel.


Figure 3.3: Mean annual household CO2 emissions from all sources by region (GB EFS dataset)4


Areas benefiting from measures


  1. The North West and North East are the regions to benefit most from the ECO to date, relative to population size, while the East and South East have benefited least. Figure 3.4 shows households receiving ECO measures, per 1,000 households, in each English region and the devolved nations. The data covers January 2013 to September 2015. One strand of the ECO aims to reduce household energy bills, while the other two strands aim to reduce carbon emissions (see Box 1.2 for more information), so uptake is influenced by the numbers of households in each region which are eligible for measures under each strand. Information about regional take-up by strand of the ECO is not available, so ECO as a whole is shown in the figure. Other factors also influence uptake of scheme benefits, including existing relationships between energy suppliers, delivery partners and customers, and the number of households which are eligible for the most cost effective measures (not just any of the measures included under the policy), as suppliers aim for the most cost effective measures first.


Figure 3.4: Households in receipt of ECO measures, per 1,000 households, by region, Jan 2013-Sept 20155


  1. Proportionally more households in Scotland and Wales have benefitted than in England as a whole. In Scotland, 76.3 households per thousand received measures during January 2013 to September 2015. For Wales this figure was 61.5, and 59.0 households per thousand received measures in England. Although some individual English regions, such as the North West, North East and the West Midlands are doing better than Scotland, households in England as a whole benefitted less. This can be attributed to additional support available for energy efficiency improvements in Scotland. For example, the Home Energy Efficiency Programmes for Scotland (HEEPS), which can be used to match-fund additional ECO funding.  In Wales similar schemes exist allowing leverage of ECO funding, for instance the Welsh Government Warm Homes Nest and Arbed schemes.


  1. Urban areas have benefited more than rural areas in the first year of the ECO, across Britain. The available evidence here, shown in Figure 3.5, only covers the first year of the ECO7 (2013). Anecdotally it is harder to get measures to rural areas due to lower housing density, as well as rural housing often being off-gas and having solid walls, making the delivery of measures to reduce emissions more costly. Thus if more recent data were available it is likely that urban areas would still be favoured. Rural properties comprised only 7.5% of all properties that received measures under ECO over 2013. The figures in the graph have been weighted to allow for the fact that more people live in urban areas8. Anecdotally, it is not dense urban areas that benefit most; as can be seen in the previous figure (3.4), a relatively low number of households in London have benefited. Rather, it appears that suburban areas do best.


Figure 3.5: Comparison of properties with measures in rural and urban areas, by obligation category 20139


  1. When the proportion of ECO measures installed is compared by rurality within the different devolved nations, urban areas again do better. It should be noted that, again, the data here only covers the first year of the ECO. Figure 3.6 shows that rural England is currently receiving the lowest proportion of measures, followed by rural Scotland and then rural Wales. When looking at urban areas, Wales and Scotland are broadly on a par, while England has a lower number of urban area properties that have benefited. A major reason for greater success in the devolved nations is that both Wales and Scotland have their own, additional, tax-funded fuel poverty programmes as well are used to leverage ECO funded.


Figure 3.6: Comparison of properties with measures, by country and rurality10


Reference box for Figure 3.6

The index on the vertical axis is created by dividing the number of properties receiving measures in each type of area by the total number of properties in the area, and then multiplying by 100.


Back to the top

References

  1. DECC (2014) Fuel poverty detailed tables 2015. Detailed tables under the low income high costs indicator. 
  2. England (2015)Scotland (2012)Wales (2014)
  3. Preston, I., White, V., Thumim, J., Bridgeman, T., and Brand, C (2013) Distribution of Carbon Emissions in the UK: Implications for Domestic Energy Policy, p.42  The urban/rural classification system used here is based on the ONS Rural and Urban Classification of Output Areas (ONS, 2003) for England and Wales. A different classification system exists in Scotland. As it is not possible to merge the two, analysis is limited to the England and Wales subset of the EFS dataset (22,017,000 weighted count).
  4. Preston, I., White, V., Thumim, J., Bridgeman, T., and Brand, C (2013) Distribution of Carbon Emissions in the UK: Implications for Domestic Energy Policy, p.43
  5. DECC (2016) Household Energy Efficiency National Statistics, headline release February 2016 Table 2.2.3
  6. DECC (2016) Household Energy Efficiency National Statistics, headline release February 2016 Table 2.2.3
  7. Centre for Sustainable Energy (2014) The ECO: an evaluation of year 1 
  8. By dividing the number of properties receiving measures in each type of area by the total number of properties in each type of area; as this resulted in a very small number it was multiplied by 100 to create an index.
  9. Centre for Sustainable Energy (2014) The ECO: an evaluation of year 1, p.80
  10. Centre for Sustainable Energy (2014) The ECO: an evaluation of year 1, p.80 The index on the vertical axis is created by dividing the number of properties receiving measures in each type of area by the total number of properties in the area, and then multiplying by 100.

Suggestions and examples


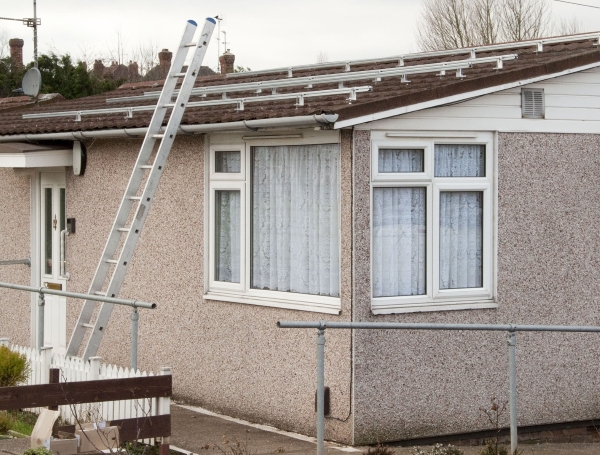
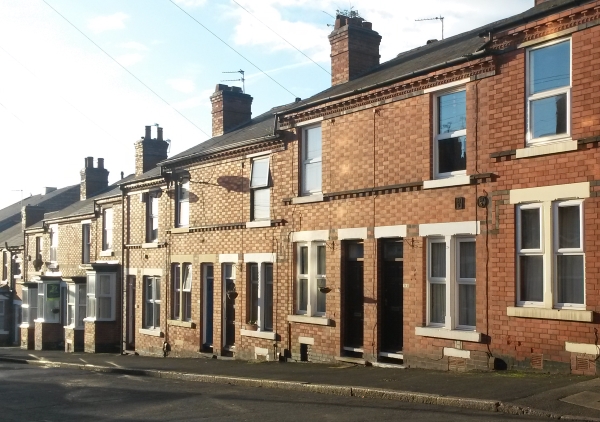
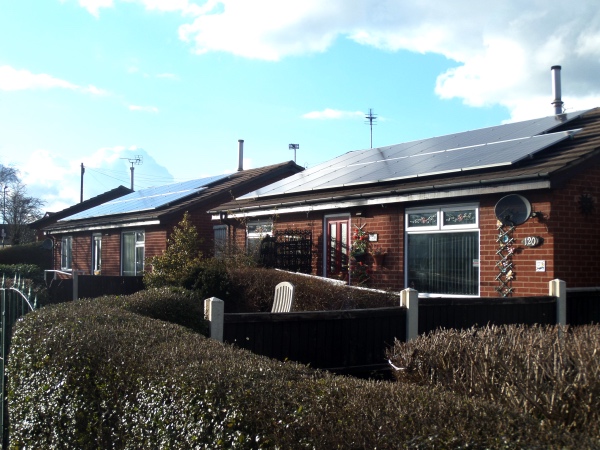
Solar PV panels being fitted on to an older person's bungalow © Derby Homes


Support access to existing policy measures for energy vulnerable and fuel poor households.  Local authorities and their partners can help to reduce the triple injustice for their local residents by facilitating access to opportunities available under current policies, for example energy efficiency measures and maximisation of state benefits. With their local knowledge they can help make sure the right people are targeted. The fuel poverty section (sections 4 and 5) contains more detailed information about policies which can help the fuel poor, and many of them are also relevant to those that may not be defined as fuel poor but still experience energy vulnerability and injustice.


Work with housing providers to support improved housing schemes. Work with social landlords and private sector landlords to support improvement of existing housing and use the planning system to ensure that new housing has high energy efficiency standards.


Recognise the contribution of the voluntary and community sectors and the importance of working with them on community energy. Local authorities can start local energy projects with their partners, or support existing community and voluntary groups. Social housing providers are in a good position to work with the community through their tenants. In a survey by DECC, 42% of people said that they would be motivated to get involved in community energy if they could save money on their energy bill1. Community energy projects can be categorised into energy efficiency (installation of energy efficiency measures and promotion of behaviour change), energy management, energy generation and energy purchase projects2, although it is common for groups to be working on more than one of these themes at once. It is also common for groups to be working on sustainability more widely, including adaptation to climate change.


Work with the community and voluntary sectors to support community energy efficiency projects which can engage local residents to think more about their energy consumption, provide information, help them to identify how they can save energy, and provide access to funding for energy efficiency measures. They may also provide other related advice in areas such as state benefits, money management, and health. Below are some case studies of community energy efficiency projects.


  • Urchfont Climate Friendly Group3: Urchfont is a rural community in Wiltshire. Urchfont Climate Friendly Group has carried out several projects promoting a more sustainable lifestyle. One of these projects involved the provision of energy surveys to 18 households, providing tailored advice on saving energy in the home.
  • Warming Barton Pioneer Places4: Barton, a suburb of Oxford, is among the most deprived 10% of neighbourhoods in the UK with a high proportion of poorly insulated and ‘hard to treat’ properties. Oxford City Council worked with local partner the Low Carbon Hub and funding from DECC to offer free energy assessments, which were taken up by 119 households. Fully or partly funded measures were also offered, with households saving an average of £450 on their bills. Connections with existing local groups and the Council have been key to the success of the project. Following on from this project, the Low Carbon Hub teamed up with an ECO provider to install solid wall insulation on 27 homes in the area. The project has been extended into a larger ‘Warming Oxford’ programme which will be available to other deprived areas in the city.
  • Manchester Carbon Co-op: This is a group of residents which was established in 2008 to carry out energy efficiency changes in their own homes and communities. The group is run as a co-operative and community benefit society. Projects run by the group include the offering of a ‘Home Energy Planner’ online assessment tool to profile current usage and make decisions on energy efficiency measures and a Champions programme to try and recruit other local people to the retrofit programme.

Work with the community and voluntary sectors to support the development of smart community energy management projects. This is a new type of community energy project which is being facilitated by new technology such as smart meters and remote monitoring.  This focuses on changing the time of energy demand to fit better with times of high renewable energy generation or to reduce the impact of peak demand on infrastructure. Below are some case studies of smart community energy management.


  • The Less is More project is a pilot project which aims to help communities reduce their electricity use, especially at peak times. The project is being run in ten communities, by Western Power Distribution (WPD), one of the electricity distribution networks, in partnership with several local energy charities. Reducing peak electricity demand reduces maintenance costs of substations and so the pilot is looking at whether it is more cost effective to offer communities an incentive to reduce their peak demand than it is to upgrade substations to accommodate increasing demand. The communities can win up to £5,000 for reducing electricity demand.
  • Ashton Hayes, a village in Cheshire which has been working for several years to reduce domestic energy demand in the Ashton Hayes Going Carbon Neutral project, has teamed up with the local electricity network operator to monitor electricity demand and the contribution of community renewable generation. This information has helped to engage the community with their energy use to a greater degree5.


Work with the community and voluntary sectors to support the development of community energy generation projects. These can be more complicated than energy efficiency projects, but for more experienced groups they provide a focus and a way to reach out to other parts of the community. Repowering London is an example of a community energy generation project.


  • Lambeth Council worked with Repowering London, which is a not-for-profit organisation that co-produces community-owned renewable energy projects with local authorities and community groups. Its solar project on the Roupell Park Estate in Brixton6 was funded via a community share offer. The usual minimum shareholding is £250 but estate residents had access to a lower minimum shareholding of £50, which gave more residents the opportunity to be active participants in the project. Some of the energy generated is used on-site, with the rest sold back to the grid. The project has also provided work experience for 15 local young people.
  • The DECC funded Low Carbon Communities Challenge (LCCC) funded community-scale approaches to the delivery of low carbon technologies and engagement activities, both those led by community groups and those led by existing agencies such as local authorities. The evaluation report gives useful insights into how these worked.
  • Bath and West Community Energy was established in 2010 to initiate projects that offer local people a say in how their energy is generated and used, and that help to retain the economic value of this at a local level. Bath and West Community Energy have been involved in the installation of a number of solar PV arrays on schools and community buildings as well as ground mounted solar arrays and hydro projects. Projects are financed through combinations of member shares, bank loans and financial partnerships. A share of the profits are put into a Community Fund to finance more local, low carbon projects.
  • Plymouth Energy Community (PEC) is a community benefit society which aims to transform the way that residents of Plymouth buy, use and generate power. As part of this they are responsible for the installation of a 4.1MW solar array, the biggest in Plymouth. Energy from the array will be sold to the grid and the profits used to fund further activities of PEC.
  • Owned as a community co-operative, Exeter Community Energy (ECOE) aim to take ownership of renewable energy projects and to share the financial benefits amongst shareholders. First established in 2013 ECOE have so far installed four rooftop solar installations. 


Be supportive of community groups that are actively promoting sustainable living and increasing resilience (such as Transition Towns), whether they are in affluent or disadvantaged areas.  Disadvantaged groups tend to require more support from the public and third sectors, but energy projects started in richer areas can spread to include other communities. In addition, if households in higher income decile groups reduce their emissions, there will be lower emissions overall, which would benefit the climate change mitigation agenda. Having more groups working on community energy means more learning and a stronger voluntary and community sector overall.


Support other collective responses, such as collective switching schemes. Collective switching schemes are being offered by local authorities or NGOs, and involve residents banding together to negotiate a better deal with their gas and electricity suppliers, with the lead organisation acting as an intermediary agent (this could be a local authority or NGO, although schemes have also been run by consumer groups). By negotiating with the big energy companies through a trusted third party, communities can harness their collective buying power to secure the best deal. Local authorities can use collective switching schemes as part of a broader strategy to engage local residents. Below are some case studies of collective switching schemes.


  • Peterborough City Council currently runs a scheme called Ready to Switch.
  • Cornwall Council in partnership with the Eden Project developed Cornwall Together, a collective purchasing group that has so far completed two rounds of bulk buying.  The group directed 10% of the switching commission from collective switching to fund fuel poverty work7.
  • Bristol's Switch and Save scheme ran in 2013 and secured deals from six energy suppliers, resulting in 1,242 households switching, each saving an average £104.81 on annual bills, with ten households saving over £500 each, and 319 households switching to greener tariffs.
  • Plymouth Energy Community runs a switching service in combination with energy helpline. 

Make sure that participants in collective switching schemes really are getting a better deal. Collective switching schemes do not always offer the best deal on the market, particularly for prepayment customers. The offers in collective switching schemes have not generally been attractive to prepayment meter users. Across 27 schemes funded by DECC's Cheaper Energy Together programme, only 3% of switches were to prepayment meter tariffs8. The Big Switch by Which? in 2012 did not include prepayment customers9, and the overall winning tariff was more expensive than the cheapest available on the market10. Consumers may be able to get an equally good deal by using a comparison site, but the benefit of switching schemes is that their collective nature encourages people to get involved who might otherwise not get round to looking for a better deal or who might be worried about looking for better a deal by themselves. Critics have pointed out that if energy suppliers offer low tariffs to new customers under collective switching schemes, they could be funding these by increasing prices for existing ‘sticky’ customers (those unlikely to switch)11.


There are also opportunities for local authorities to change the configuration of energy supply locally by becoming energy suppliers themselves. Some urban local authorities are taking forward district heating projects. This is usually motivated both by the desire to build infrastructure for a low carbon future, and to reduce energy bills (or at least maintain stability in energy bills over the long term) for local businesses and people.  A local authority looking to install district heating as a way of reducing carbon emissions can also incorporate this scheme into their fuel poverty strategy to ensure vulnerable households are prioritised. In particular, large centrally located social housing blocks in need of updating are good candidates for being included in a district heating scheme. The costs must be carefully controlled to make sure that district heating does not end up costing local homes and businesses more than the alternative.  The Homes and Communities Agency has produced a Good Practice guide based on 13 case studies of district heating projects implemented by local councils. Below are some case studies on district heating.


  • As part of the Birmingham Energy Savers Partnership12 between Birmingham City Council and Carillion Energy Services, three high-rise blocks of flats in Newton have had EcoPod District Heating Systems installed. The EcoPod is a specialised energy centre designed to work from the roof of a high rise building. Two hundred flats in areas suffering from high levels of fuel poverty have been connected to the systems.
  • Aberdeen Heat and Power is a non-profit company set up by Aberdeen City Council.  A combined heat and power (CHP) district heating system was identified by Aberdeen City Council as the best way to deliver energy to the Hazelhead community. The Hazelhead Estate was originally council housing, although many homes are now privately owned. The system services 198 dwellings with heat, and a large school with heat and electricity. The project has reduced carbon emissions and has helped to tackle fuel poverty by providing low cost heating to council tenants13.
  • In London, the Bunhill Heat and Power network is operated by Islington council and provides energy to over 700 homes.  The energy centre uses a CHP (Combined Heat and Power) system which uses the waste heat created producing electricity to heat the homes. In the second phase of the project additional homes will be connected and the pipe network will be extended to tap waste heat from the London underground network. The electricity produced by the CHP is sold to the national grid, meaning that fuel bills are subsidised, helping to tackle fuel poverty.

Back to the top

Actions to take


  1. Take steps to tackle fuel poverty. See sections 4 and 5 of the fuel poverty message for more information.

  2. Work with energy suppliers or local agencies to target information and measures to low income areas which qualify for ECO funding. ECO (the Energy Company Obligation) is the main energy supplier-funded policy and requires energy suppliers to install energy saving measures or efficient heating measures in households, with each of the large energy supply companies having targets in terms of energy bill cost saving and carbon emissions reductions achieved in the households which have measures installed. It has three strands: the Home Heating Cost Reduction Obligation (HHCRO), the Carbon Saving Communities Obligation (CSCO), and the Carbon Emissions Reduction Obligation (CERO).  The first two of these are aimed at low income households:
  • The HHCRO is about reducing energy costs for low income households, with measures such as replacement boilers.
  • The CSCO is about reducing carbon emissions in the most deprived 25% of Lower Super Output Areas, as identified by the indices of deprivation, which are produced separately with slightly different methodologies for England, Wales and Scotland. A list of these areas is available from DECC.
  1. Raise awareness of the financial support for fuel payments available (as of 2015):
  • Winter Fuel Payments are available for those over 62
  • Cold Weather Payments are made during periods of very cold weather to help people to pay for extra heating costs, and are available to those in receipt of certain benefits
  • Warm Home Discount Scheme  – participating energy companies provide a discount (£140 for winter 2015-16) on the electricity bills of certain customers.
  1. Raise awareness of the grant schemes for improving energy efficiency. Energy Company Obligation (ECO) is an energy efficiency programme for households. Under the Energy Company Obligation (often simply called ECO), some low income households can get grants to cover the whole cost of cavity wall or loft insulation, and significant grants towards other improvements like new boilers. Other people are eligible for grants for cavity wall and loft insulation because they live in a particular location, known as a Carbon Saving Community area. Currently, everybody else can claim a grant towards the cost of cavity wall or loft insulation, or insulating a ‘hard-to-treat’ cavity wall.

  2. Embed goals related to energy efficiency within housing services such as homelessness prevention, affordable housing, housing asset management, and the enforcement of minimum housing standards in the private rented sector (see also part 4.2.3 of the fuel poverty section.
  3. Make private landlords aware of their responsibilities and tenants aware of their rights. Currently private sector landlords in England and Wales must provide an Energy Performance Certificate (EPC) for the property to new tenants, and in the coming years private sector landlords in England and Wales will be legally required to meet energy efficiency standards. See section 4.2.3 of the fuel poverty section for more information.
  4. Enforce private rented sector standards. Local authorities already have a legal duty to take ‘appropriate action’ wherever a property is found to have a ‘Category 1 hazard’ (the most serious hazard, e.g. no fire alarm, inadequate heating) under the Housing Health and Safety Rating System (HHSRS).
  5. Ensure the energy efficiency of new build.  Use planning processes and regulations to drive up standards to achieve zero carbon in new developments and to improve existing homes through the use of Allowable Solutions.  Many councils including Leicester City Council and Ipswich Borough Council are working with developers to ensure that new developments exceed the minimum standards of energy efficiency1.
  6. Engage the local community in energy efficiency programmes2.
  • Design bespoke outreach programmes to engage the disadvantaged sections of the community you are trying to help and secure their views.  Build this into the overall strategy.
  • Employ local people to engage residents through an active participation process, such as energy efficiency workshops and bespoke community events.
  • Use appropriate language for engaging these audiences: for example, focus on public health as well as climate change.
  1. Support community action on energy. Encourage and support community energy projects that have arisen within the voluntary and community sector. Look for ways to support them, perhaps brokering introductions, endorsing their work, or linking to them on your website. Support affluent groups as well as those from disadvantaged areas, and encourage them to have a focus on social justice in their work.
  • Plan Local is a set of resources available to communities and groups that are planning low carbon living projects. It includes short films and resources to help with setting up a group, dealing with the planning system, including neighbourhood planning, getting funding and consulting the community.
  1. Support community energy generation projects by helping them to access funding:
  • In Scotland, the Community and Renewable Energy Scheme (CARES) has been established by the Scottish Government to encourage local and community ownership of renewable energy across Scotland.
  • In Wales, the Ynni’r Fro programme uses European Structural Funds to offer community-based social enterprises grant aid, loans and free, independent, hands-on advice and information to help them develop their own community-scale renewable energy schemes across Wales.
  • For rural areas in England, the Rural Community Energy Fund supports rural communities in England to develop renewable energy projects which provide economic and social benefits to the community. It provides grants of up to £20,000 to support public consultation and viability studies, and loans of up to £130,000 to support planning applications and development of business cases to attract further funding.
  • For urban areas in England, the Urban Community Energy Fund supports community groups to develop renewable energy projects. Like the Rural Community Energy Fund, it provides grants of up to £20,000 to support public consultation and viability studies, and loans of up to £130,000 to support planning applications and development of business cases to attract further funding.
  • For renewable electricity developments, the Feed In Tariff is a payment which is made per unit of electricity generated by small-scale renewable energy systems of up to 5 megawatts (MW) total installed capacity.
  • For renewable heat installations, the Renewable Heat Incentive  (RHI) is a grant payment made to support the cost of installations and based on estimated heat output and technology type. The domestic version of the grant, applicable to single domestic dwellings, is paid over seven years while the non-domestic version, applicable to larger installations, is paid over 20 years. 
  • Local authorities may be able to help community energy projects with funding; for example, DECC’s Community Energy Strategy identifies the Zero Carbon Homes Allowable Solutions framework as a potential source of funding for community groups, starting in 20163.
  1. Make use of new technological developments such as smart meters, and support their roll out and use in encouraging energy saving behaviours.  Innovative technology could prove useful in helping people engage with their energy use, either through the information the meters provide or when a visit is made to the property to install a meter, which provides an opportunity to provide advice to the household or assess the energy efficiency of the property.
  2. Develop or support a local collective switching scheme which incorporates information about consumer rights in the energy market and signposts to advice. Collective switching schemes give consumers the confidence to switch if they don't feel confident enough to do it on their own. Collective switching scheme should encourage people to check the whole market as well as the deals offered by the scheme itself, and help people to understand what would be the best deal for them. This could include information about switching with a prepayment meter and different ways of paying for energy. It could also include referrals to sources of energy efficiency advice (such as local energy advice centres) and referrals to ECO schemes, as well as to wider services such as debt advice and benefits eligibility checks. 
  3. Help people to become aware of their rights in the energy market. Citizens Advice runs the Energy Best Deal Programme in England, Wales and Scotland. This is a public awareness campaign which aims to improve consumers’ knowledge of switching, the help available, and energy efficiency and is delivered by members of Citizens Advice's financial capability forums. Local authorities can find out what sessions are being delivered in their area and signpost people to Energy Best Deal events.
  4. Investigate the possibility of district heating for your local area. The Heat Networks Delivery Unit (HNDU) provides guidance and funding for local authorities that are developing heat networks. Currently support is restricted to selected local authorities, but there may be further bidding rounds for other local authorities to apply for HNDU support. Further information can be found in the guidance provided by the HNDU.


Back to the top


On this page:


Tools and Resources


Name

Developer / Author

Type of Resource

Guides for local authorities and partners

Tackling fuel poverty through local leadership

Local Government Association

Guide for local authorities, with case studies

Developing your comprehensive community engagement strategy

Improvement and Development Agency for local government, Urban Forum and the National Association for Voluntary, and

Community Action

Guide for local strategic partnerships

Not another consultation! Making community engagement informal and fun

Involve, on behalf of Local Government Improvement and Development’s Healthy Communities Programme

Guide for local government practitioners

UK District Energy Association

Website with guidance and information (membership required for access to parts of the site)

Website

District Heating Good Practice Guide

The Homes and Communities Agency

Guide based on 13 case studies of district heating projects implemented by local councils

Heat Networks Delivery Unit

DECC

Information for local authorities

Resources for communities

The Source

Collated by the Centre for Sustainable Energy

Collection of resources for communities taking action on energy

Behaviour Change

National Institute for Health and Care Excellence (NICE)

Detailed principles and resources on behaviour change related to health

The National Heat Map

Centre for Sustainable Energy for DECC

Map showing density of heat demand across England

Water Source Heat Map

DECC


Report showing high level

assessment of around 40 urban rivers with the highest

potential for water source heat pump deployment for heating and cooling purposes.

Plan Local

CSE

Resources for community groups

Community and Renewable Energy Scheme

Local Energy Scotland

Guide for community groups in Scotland

Ynni’r Fro

Energy Saving Trust

Guide for community energy projects in Wales

Rural Community Energy Fund

WRAP

Guide for community groups in rural areas of England

Urban Community Energy Fund

DECC

Guide for community groups in urban areas of England

Simple guides to policies and programmes

Winter Fuel Payments

DECC

Guide for consumers

Cold Weather Payments

DECC

Guide for consumers

Warm Home Discount Scheme

DECC

Guide for consumers

Feed In Tariff

DECC

Guide for consumers

Renewable Heat Incentive

Ofgem

Guide for consumers

The Energy Company Obligation

DECC's

Guide for consumers

Green Deal

DECC

Guide for consumers

Energy Best Deal

Citizens Advice

Overview of the Energy Best Deal programme

Statistics

UK Greenhouse Gas Emissions Statistics

DECC

National statistics

Fuel poverty detailed tables (2013)

DECC

Data tables

English Indices of Deprivation (2015)

Department for Communities and Local Government

Data tables

Scottish Index of Multiple Deprivation (2012)

Scottish Government

Data tables

Welsh Index of Multiple Deprivation (2014)

Welsh Government

Data tables


Strategies and Reports


Name

Developer / Author

Type of Resource

Ofgem's Consumer Vulnerability Strategy

Ofgem

Strategy

DECC Community Energy Strategy

DECC

Strategy (also has case studies)

Cutting the cost of keeping warm. A new fuel poverty strategy for England

DECC

Strategy

Distribution of Carbon Emissions in the UK: Implications for Domestic Energy Policy

Preston, I., White, V., Thumim, J., Bridgeman, T., and Brand, C (2013)

Report

A Definition of Poverty

Joseph Rowntree Foundation

Report

Climate Change and Social Justice: An Evidence Review

Joseph Rowntree Foundation

Evidence review

Monitoring poverty and social exclusion 2013


Joseph Rowntree Foundation

Report

5 facts about household energy spending in the UK 2002-2012

Office for National Statistics

Report

Integrating Behaviour Change in Low Carbon Housing Retrofit

LCEA Behaviour Change Retrofit Group

Report from a Housing Retrofit Programme in Greater Manchester

Addressing the Poverty Premium: Approaches to regulation

Hirsch, D. (2013)

Report

Fuel and poverty: A Rapid Evidence Assessment for the Joseph Rowntree Foundation,

Preston, I., White, V., Blacklaws, K. (2014)

Report

Energy prices and bills - impacts of meeting carbon budgets

Committee on Climate Change

Report

Estimated impacts of energy and climate change policies on energy prices and bills

DECC

Report

The distribution of total embodied greenhouse gas emissions by households in the UK, and some implications for social policy.

Gough, Ian, Abdallah, Saamah, Johnson, Viki, Ryan-Collins, Josh and Smith, Cindy (2011)

Report


Case studies and examples


Name

Developer / Author

Type of Resource

Repowering London

Repowering London

Example

Less is More

Centre for Sustainable Energy

Example

Ashton Hayes

Ashton Hayes Going Carbon Neutral

Example

Cornwall Together

Eden Project

Case study

District heating

Cogenco

Case study

Manchester Carbon Coop

Society for the Reduction of Carbon Limited

Case study

Low Carbon Communities Challenge

DECC

Evaluation report

Helping Customers Switch: Collective Switching and Beyond

DECC

Evaluation report

Bath and West Community Energy

Transition Bath Energy Group and Transition Corsham

website

Plymouth Energy Community (PEC)

Plymouth City Council (PCC)

website

Exeter Community Energy (ECOE)

Transition Exeter

website


Back to the top