1. Where
There is an uneven distribution of climate disadvantaged neighbourhoods across the UK.
On this page:
- Introduction
- Using maps to identify vulnerable people and places
- Social vulnerability
- Socio-spatial vulnerability to impacts of heat
- Socio-spatial vulnerability to impacts of flooding
- Climate disadvantage
Introduction
Some people and groups are more susceptible to the negative impacts of climate-related hazards due to their different abilities to deal with them. There are many studies of social vulnerability and many causes which have been identified. Some of the factors affecting the potential for different impacts between people and places as a result of flooding and heatwaves are listed in Table 1, below. Studies have also been carried out for particular parts of the UK1 and for different types of climate-related events.2,3
Using maps to identify vulnerable people and places
This website provides new maps to show practitioners how different people and places are likely to be affected by flooding and high temperatures. Social vulnerability maps show places where the current characteristics of people and communities could result in negative impacts on their well-being from flooding or high temperatures. These maps are combined with others showing the potential to be exposed to flooding (in the present day) and high temperatures (in the 2050s). Combined maps - flood disadvantage and heat disadvantage - show how the likelihood of being affected compares with the potential for severe impacts on well-being in an area.
Maps have been created using a new mapping framework applied to local neighbourhoods. Since this web resource was launched, the framework has been further developed for finer scale assessment of flood vulnerability and disadvantage across the whole of the UK25. Heat-related data have not been changed and are still only available for England via this resource (although analysis for the devolved nations for 2001 has been published separately). Users interested to access the coarser scale data of flood vulnerability and disadvantage in England for 2011 developed using the original framework can access our archived maps and related explanation. The rest of the material on flood vulnerability and disadvantage in the Which places are disadvantaged? section relates to the revised method and results for England, Scotland and Wales. Full documentation is available separately in the final report of the revised work26, including results for Northern Ireland. Maps for Northern Ireland are not available on this resource due to licence restrictions. The following text includes extracts of the final report, reproduced with the permission of the lead author.
Flood vulnerability and disadvantage neighbourhoods are quite small. The revised flood maps have been created using neighbourhoods which in 2011 represented around 1,600 people on average in England and Wales and around 800 people on average in Scotland.
Heat vulnerability and disadvantage neighbourhoods are quite large. Currently available only for England, heat vulnerability and disadvantage maps have been created for neighbourhoods of around 7,800 people on average in 2011. This means that therefore some areas are not as well represented as others. These might include rural areas where the geographical zones are disproportionately large, or places where there are distinct contrasts in population or physical characteristics over relatively small areas.
The map framework can be adapted and extended to suit local circumstances and data availability. Indeed, the maps should be seen as a starting point to support you through the process of identifying local geographical distributions of vulnerability and disadvantage and developing actions to respond.
• See the video introduction with an explanation of how use the maps
• See the section on benefits and drawbacks of the maps for a full list of caveats to consider when using the maps provided. See Section 3, above, for more information about how vulnerability should really be recognised as a process, rather than a static characteristic.
Much of the evidence used in the maps is already available, but it is often not provided in a form which helps develop an appreciation of the full range of factors driving negative effects on wellbeing in a local area, particularly those related to social causes. Traditional resource-based measures of well-being used by economists, for example, the loss of income or property values due to extreme weather, do not go far enough to capture the full range of losses and wider social impacts involved.4 Richer accounts of social vulnerability are available, but they tend to be qualitative and provide only one type of evidence that decision-makers need. Social deprivation indices have become the de facto means of measuring and mapping social vulnerability. While these indices have a role to play and contain many of the factors of interest, they do not include them all. As a result, practitioners and other decision-makers may miss out on developing responses to target those in most need and miss opportunities for taking action.
|
Box 1: Foundations for the mapping work in this study There is much debate about how to define and characterise social vulnerability and its connection to vulnerability more widely. According to the IPCC, vulnerability to climate change is: a function of the character, magnitude, and rate of climate variation to which a system is exposed, its sensitivity, and its adaptive capacity.1 On this website we distinguish vulnerability and climate disadvantage. The concept of vulnerability is used to describe the capacities of individuals and social groups to respond to the impacts of adverse events. A useful characterisation of vulnerability is offered by Kelly and Adger: ‘we define vulnerability in terms of the ability or inability of individuals and social groupings to respond to, in the sense of cope with, recover from or adapt to, any external stress placed on their livelihoods and well-being.’2 Vulnerability is a matter of how external stresses impact on well-being. How vulnerable an individual or group will be to a climate related event depends upon not just their personal sensitivity to the event, but also the environmental and social factors that lead to losses in well-being. How far an individual or group is disadvantaged by a climate related event will depend on both their vulnerability and the degree to which they are exposed to the event.3 It is helpful to consider the adjustments required to avoid negative consequences of events in terms of what can be done before, during and after events to minimise impacts. These phases are more commonly considered in disaster management frameworks.4 but can be applied to climate adaptation and climate-related extreme weather. They connect to the means of building community resilience. Resilience and vulnerability are closely related to each other. A useful definition of social resilience is ‘the ability of groups or communities to cope with external stresses and disturbances as a result of social, political and environmental change.'5 Addressing the personal, environmental and social factors that affect the degree to which a community is vulnerable to a hazard such as flood, drought or heatwave will also address how well a community is able to bounce back after the impacts of the hazard. A community that is better able to prepare for, respond to and recover from external hazards like floods or heat waves will be more resilient to that hazard. Building resilience needs to account for: the degree to which the community comes into contact with a hazard capable of causing harm; the amount of inherent susceptibility to harm in that community; and the extent to which people in the community are able to make adjustments in order to avoid negative consequences. 1. IPCC (2007) Climate Change 2007: Impacts, Adaptation, and Vulnerability. Contribution of Working Group II to the Fourth Assessment Report of the Intergovernmental Panel on Climate Change, Parry, M. L., Canziani, O. F., Palutikof, J. P., van der Linden, P. J. and Hanson, C. E. (eds). Cambridge: Cambridge University Press p. 883 2. Kelly, P. M. & Adger, W. N. (2000) Theory and Practice in Assessing Vulnerability to Climate Change and Facilitating Adaptation. Climatic Change, 47(4) 325-352. 3. Lindley, S. J., O’Neill, J., Kandeh, J., Lawson, N., Christian, R. & O’Neill M. (2011) “Climate change, justice and vulnerability”, Joseph Rowntree Foundation Report, York 4. ISDR International Strategy for Disaster Reduction (2005) Hyogo Framework for Action 2005-2015: Building the Resilience of Nations and Communities to Disasters 5. Adger, N. 2000, ‘Social and ecological resilience: are they related?’ Progress in Human Geography 24: pp. 347–364, page 347.
|
Social vulnerability
Social vulnerability comes about through the interaction of a number of personal, environmental and social factors that affect the way in which climate hazards impact on the well-being of individuals or groups:
- Personal features of the individual such as age and health;
- Environmental characteristics such as the availability of green space, quality of housing stock or elevation of buildings;
- Social and institutional context, such as levels of inequality and income, the strength of social networks, the cohesion of neighbourhoods and the day-to-day practices of institutions, such as care regimes in nursing homes. Social factors can be very influential on the outcomes of heatwave events, yet evidence suggests that the design of responses still tends to over-rely on assessments of people’s biophysical susceptibilities,5 i.e. their sensitivity.
Socio-spatial vulnerability to impacts of heat
Maps of socio-spatial vulnerability to heat are provided in the mapping tool showing how the personal, social and environmental factors which help to explain uneven impacts from extreme events like heatwaves come together in particular neighbourhoods. Vulnerability is measured through five dimensions (see Box 1):
- Sensitivity – personal biophysical characteristics, such as age and health, which affect the likelihood that a heatwave event will have negative welfare impacts;
- Enhanced exposure – the aspects of the physical environment, such as the availability of green space or housing characteristics, which tend to accentuate or offset the severity of heatwaves;
- Ability to prepare – primarily the social factors that enable individuals or communities to prepare for heatwaves;
- Ability to respond – primarily the social factors that enable individuals and communities to immediately respond to heatwaves, such as income, personal mobility, fear of crime and community networks;
- Ability to recover – primarily the social factors that enable individuals and communities to recover from heatwaves, such as income, social networks and availability of hospital and GP services.6
Social vulnerability to impacts of flooding
Maps of social vulnerability to flooding are provided in the mapping tool showing how the personal, social and environmental factors which help to explain uneven impacts from extreme events like flooding come together in particular neighbourhoods. The new Neighbourhood Flood Vulnerability Index (NFVI) provides insight into the social vulnerability of a neighbourhood should a flood occur. The NFVI combines five characteristics of vulnerability:
- Susceptibility - describing the predisposition of an individual to experience a loss of well-being when exposed to a flood. It is widely evidenced that the dominant characteristics that influence susceptibility to harm relate to the age (the old and very young) and health of the individuals exposed.
- Ability to prepare - reflecting the actions taken by an individual during normal conditions (i.e. in the absence of a forecast or actual flood) that are likely to reduce the harm they suffer when a future flood occurs. Although an area of continued research, an individual’s ability to prepare is influenced by their income, capacity to act, local knowledge and property tenure.
- Ability to respond – reflecting the underlying reasons why some individuals act more effectively in the run up to and during a flood. Although this is an area of continued research, there is broad agreement that an individual’s ability to respond is influenced by their income, capacity to access and use formal and informal information, local knowledge and physical mobility.
- Ability to recover – reflecting the degree to which an individual can aid their own recovery is influenced by several factors, particularly their income, capacity to use information, and physical mobility. Many flood events have highlighted the length of time it can take for individuals and communities to recover from a flood.
- Community support – recognising how the availability and quality of services provided by health and emergency services as well as broader care and social services influence the severity of harm caused by a flood . A formal representation of community cohesion and its influence on flood vulnerability is not available. However, the following are considered to gauge the nature of this support: housing characteristics; the collective experience of past floods; the likely availability of community services in a flood (including emergency service provides, schools, GPs, care homes); and the social networks that exist.
Climate disadvantage
Maps of climate disadvantage show how social vulnerability combines with the potential for exposure to hazards – current and future flood likelihood and patterns of high temperatures - in local neighbourhoods. Climate disadvantage can be estimated and mapped through the combination of representations of hazard-exposure and socio-spatial vulnerability.7 The relationships between the different datasets available in this resource for heat-related events are illustrated in Figure 1b, based on the overall conceptual framework in Figure 1a. The equivalent information for flood-related events is given in Figures 2b and 2a respectively.
New flood disadvantage data for England, Scotland and Wales further develops the previous work available on this site. The Social Flood Risk Index (SFRI) is used “to identify where vulnerability and exposure coincide to create flood disadvantage” (p. i). The data are calculated at both neighbourhood (SFRI) and individual (iSFRI) levels. In the original work flood disadvantage was considered to be a ‘geographical’ phenomenon highlighting issues of distributional justice. This geographical interpretation has been retained in the revised data. However, ideas have also been further developed to consider ‘systemic’ disadvantage. This considers “the degree to which the most vulnerable neighbourhoods are disproportionally affected by flooding when compared to less vulnerable neighbourhoods”. The range of metrics used in the revised work is shown in Figure 3 with definitions given in Table 2 and key findings summarised in Section 3, above. Also see our SFRI Information Sheet for a more detailed description.
In addition to the present day, the revised data also consider future disadvantage. Future risks in relation to fluvial, coastal and surface water flooding are estimated for the 2020s, 2050s and 2080s according to exogenous (external) and endogenous (internal) drivers of change. See our map tool to explore the data for the present day and for 2050s scenarios for a +2◦C and +4◦C rise in Global Mean Temperatures for fluvial/coastal and surface water flooding. Data for this purpose have been provided by the authors of the latest research , with further details, scenarios and other features of the revised work (including exposure metrics) explained in the full report and related technical user guide. There is also a new academic publication based on the research.
This website provides new information to support practitioners in the process of a broader and deeper consideration of social vulnerability and climate disadvantage at the local level. Data are available for 2011 for England, Scotland and Wales with respect to flooding and for England with respect to heat. Equivalent data for Scotland, Wales and Northern Ireland for 2001 for heat and flood (original method) can be found here8, and for Scotland only in this related research for the Scottish Government9. The information in the following sections and the associated map tool are provided to:
- Explain the aspects of well-being that are endangered by climate change but which are not yet adequately captured by existing approaches to adaptation policy
- Outline the social dimensions of vulnerability to climate change which have not yet been sufficiently recognised in adaptation policy
- Provide supporting evidence for building up local profiles of climate disadvantage and social vulnerability for your area
- Illustrate the uneven geographical distributions in climate-related social vulnerability and climate disadvantage (see Section 3, above)
-
Show how factors can be represented and mapped to develop and extend the evidence provided in the resources.
- See the list of indicators for heat used in Climate Just.
- For the new 2017 flood data, see this list of indicators and ther explanation in this summary of the Neighbourhood Flood Vulnerability Index (which includes the Information Sheets used in the map tool related to the NFVI).
- Assist with the process of using the evidence to support local decision-making, including through encouraging a consideration of limitations in the data.
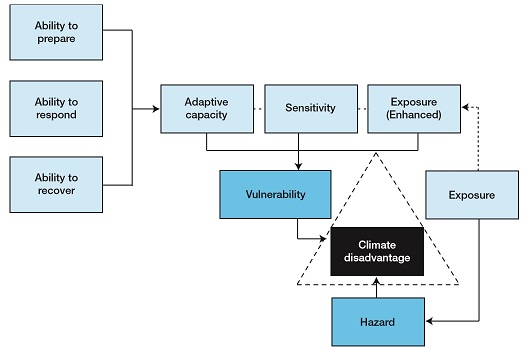
Figure 1a: Conceptual framework for assessing socio-spatial vulnerability and climate disadvantage (heat and original flood data)11
Figure 1b: The relationship between different datasets available in this resource: Climate disadvantage as a measure of socio-spatial vulnerability and hazard-exposure.
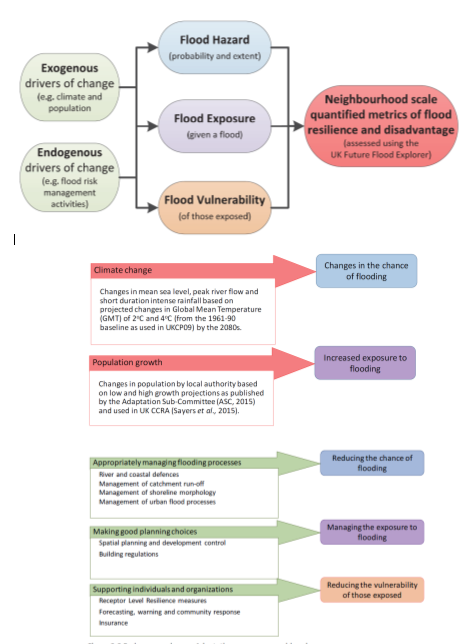
Figure 2a: New framework for assessing current and future flood disadvantage (top) considering exogenous (external) (middle) and endogenous (internal) (bottom) drivers. Also see Figure 2b for the structure of the vulnerability component.18
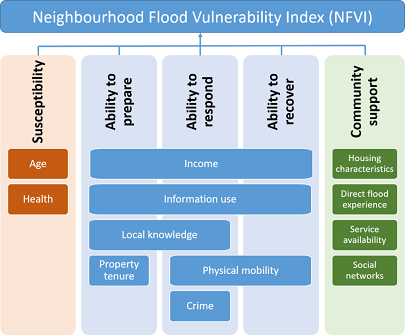
Figure 2b. The structure of the Neighbourhood Flood Vulnerability Index (NFVI)18
|
Influence |
Factor |
Heat/Flood |
|
Sensitivity: (+) increasing susceptibility;(–) reducing susceptibility |
Age: very young and elderly (+) |
Both |
|
Gender: women may be more likely to have caring responsibilities (+) men (esp. young) associated with risk-taking behaviour (+) |
Both |
|
|
Health status: illness (+) |
Both |
|
|
Physical and mental health problems (+) |
Both |
|
|
Residential care homes (+) |
Both |
|
|
Neighbourhood characteristics (+/–) |
Both |
|
|
Exposure: (+) enhancing; (–) offsetting |
Basement, single storey and mobile housing (+) |
Flood |
|
Homeless, tourists, transients (+) |
Both |
|
|
Location (+/–) |
Both |
|
|
Overcrowding (+) high housing density (+) |
Both |
|
|
Thermo-insulate housing: air conditioning (–) |
Heat |
|
|
Top-floor flats (+) |
Heat |
|
|
Unventilated buildings (+) |
Heat |
|
|
Urban dwellers (+) living in city centre (+) land cover (+/), green space (–), access to parks and green spaces (–) |
Both |
|
|
Adaptive capacity: (+) reducing ability to adapt; (–) increasing ability to adapt |
Access to decision making: increased access (–) |
Both |
|
Access to medical establishments (–) |
Heat |
|
|
Awareness and preparedness: high awareness (–) |
Both |
|
|
Density of medical establishments and services ( higher –) |
Heat |
|
|
Density and access to air-conditioned environments outside the home (–) |
Heat |
|
|
Disability, e.g. lack of mobility (+) |
Both |
|
|
Educational attainment (poor +) |
Both |
|
|
Family/household composition: large families (+), single parents (+), single-person households (+) |
Both |
|
|
Flood experience: no experience (+) |
Flood |
|
|
Income (low +) |
Both |
|
|
Insurance accessibility (good –) |
Flood |
|
|
Length of residence, linked to prior experience: short residence (+) |
Both |
|
|
Mobility: lack of transportation (+) |
Both |
|
|
Occupation: skilled (–) or unskilled (+), also linked to income and financial status |
Both |
|
|
Proportion of minority ethnic groups and new migrants/visitors, e.g. due to potential language issues (+) high population turnover (+) |
Both |
|
|
Resources available to local authorities (+/–) |
Both |
|
|
Serviced by flood warning system: yes (–), no (+) |
Flood |
|
|
Skills and access to technology, e.g. access to environmental information (lack +) |
Both |
|
|
Social isolation (+) |
Both |
|
|
Socio-economic status (+/–) |
Both |
|
|
Social deprivation (high +) |
Both |
|
|
Tenancy characteristics: Renters (+), homeowners (–) |
Both |
|
|
Trust in authorities: no (+), yes (–) |
Both |
|
|
Unemployment (+) |
Both |
Table 1: Factors determining uneven impacts to the same climate-related event. Divided into three broad groups: sensitivity, exposure and adaptive capacity.11,12,13

Figure 3: Metrics used in the new social flood vulnerability and disadvantage research18. The new maps available in this resource relate to the Neighbourhood Flood Vulnerability Index (NFVI) and Social Flood Risk Index (SFRI). Key findings for these and other metrics are summarised in Section 3, above. See the full report for further explanation of methods and further detail on findings for the full range of metrics. Definitions are given in Table 2 below.
|
Metric |
Insight provided |
|
Exposure metrics |
|
|
Floodplain population (FP) |
The scale of the potential exposure within a neighbourhood in the absence of defences. |
|
Expected Annual Probability of flooding: Individual (EAI) |
An individual’s annual ‘average’ exposure to flooding, taking account of defences. Athough not representative of any specific individual this provides a means of comparing the ‘average’ exposure between neighbourhoods. |
|
Number of People Exposed to Frequent Flooding (PEFf) |
The number of people exposed to flooding more frequently than 1:75 years, on average. |
|
Vulnerability metrics |
|
|
Neighbourhood Flood Vulnerability Index (NFVI) |
The propensity of those living in a neighbourhood to suffer a loss of well-being should a flood occur. |
|
Risk metrics |
|
|
Expected Annual Damages (EAD) - Residential only |
The annual ‘average’ direct economic damages, in monetary terms, taking account of defences.
This provides the conventional view of risk that estimates the Expected Annual Damages in national economic terms. |
|
Expected Annual Damage: Individual (EADi) |
The average (economic) risk faced by an individual living within the floodplain. Although not representative of the risk faced by any specific individual this provides a means of comparing risks between neighbourhoods. |
|
Relative Economic Pain (REP) |
The ‘relative pain’ of the economic risks faced by those exposed to flooding (expressed as the ratio between uninsured economic damages and household income).
REP = (1- insurance penetration) x Expected Annual Damages (direct residential) per household within the floodplain / Average income per household within the neighbourhood. |
|
Social Flood Risk Index (SFRI - also see the Information Sheet for more detail) |
The level of social flood risk (a combination of exposure, vulnerability and probability of flooding), at a neighbourhood scale (SFRI) and as an individual ‘average’ (iSFRI).
SFRI Group = Expected Annual Probability of Flooding: Individual (EAI) x Number of people within the floodplain (FP) x Neighbourhood Flood Vulnerability Index (NFVI).
SFRI Individual = Expected Annual Probability of Flooding: Individual (EAI) x Neighbourhood Flood Vulnerability Index (NFVI). |
Table 2: Vulnerability and risk metrics used to determine the degree of social flood resilience in revised work on social vulnerability and climate disadvantage with respect to flooding18. Also see the separate technical user guide.
References
- Zsamboky, M., Fernandez-Bilbao, A., Smith, D., Knight, J. & Allan, J. (2011) “Impacts of climate change on disadvantaged UK coastal communities”, Joseph Rowntree Foundation, York.
- Houston, D., Werritty, A., Bassett, D., Geddes, A., Hoolachan, A. & McMillan, M. (2011) “Pluvial (rain-related) flooding in urban areas : the invisible hazard”, Joseph Rowntree Foundation, York.
- Benzie, M, Harvey, A, Burningham, K, Hodgson, N and Siddiqi, A (2011) Vulnerability to heatwaves and drought: adaptation to climate change, JRF.
- Lindley, S., O’Neill, J., Kandeh, J., Lawson, N., Christian, R. & O’Neill M. (2011) “Climate change, justice and vulnerability”, Joseph Rowntree Foundation Report, York.
- Lindley, S., O’Neill, J., Kandeh, J., Lawson, N., Christian, R. & O’Neill M. (2011) “Climate change, justice and vulnerability”, Joseph Rowntree Foundation Report, York.
- Lindley, S., O’Neill, J., Kandeh, J., Lawson, N., Christian, R. & O’Neill M. (2011) “Climate change, justice and vulnerability”, Joseph Rowntree Foundation Report, York.
- References Lindley, S. J. & O’Neill, J. (2013) Flood disadvantage in Scotland: mapping the potential losses in well-being. Scottish Government Social Research.
- Lindley, S., O’Neill, J., Kandeh, J., Lawson, N., Christian, R. & O’Neill M. (2011) “Climate change, justice and vulnerability”, Joseph Rowntree Foundation Report, York.
- McGregor, G. R., Pelling, M., Wolf, T. and Gosling, S. (2007) The Social Impacts of Heatwaves, Science Report – SC20061/SR6. Environment Agency.
- Tapsell, S. M., Tunstall, S. M., Green, C. and Fernandez, A. (2005) Indicator set. Report T11-07-01 of FLOODsite Integrated Project, Flood Hazard Research Centre, Enfield. [Accessed 29 September 2011] Tapsall, et al., 2005.
- Cutter, S. L., Emrich, C. T., Webb, J. J. and Morath, D. (2009) Social Vulnerability to Climate Variability Hazards: A Review of the Literature. Hazards and Vulnerability Research Institute, University of South Carolina, Columbia.
-
Sayers, P.B., Horritt, M., Penning Rowsell, E., and Fieth, J. (2017). Present and future flood vulnerability, risk and disadvantage: A UK scale assessment. A report for the Joseph Rowntree Foundation published by Sayers and Partners LLP.
-
Sayers, P.B., Horritt, M., Penning Rowsell, E., and Fieth, J. (2017). Present and future flood vulnerability, risk and disadvantage: A UK scale assessment. A report for the Joseph Rowntree Foundation published by Sayers and Partners LLP.
-
Sayers, P.B., Horritt, M., Penning Rowsell, E., and Fieth, J. (2017). Present and future flood vulnerability, risk and disadvantage: A UK scale assessment. A report for the Joseph Rowntree Foundation published by Sayers and Partners LLP.
-
National Flood Community Resilience Pathfinders schemes, Defra, 2012, 2015. Defra (2012). Flood Resilience Community Pathfinder Prospectus Defra (2012b) UK Climate Change Risk Assessment Evidence Report. Defra, 2015 Flood Resilience Community Pathfinder Evaluation Final Evaluation Report October 2015.
-
Sayers, P.B., Horritt, M., Penning Rowsell, E., and Fieth, J. (2017). Present and future flood vulnerability, risk and disadvantage: A UK scale assessment. A report for the Joseph Rowntree Foundation published by Sayers and Partners LLP.
-
Sayers, P.B., Horritt, M., Penning Rowsell, E., and Fieth, J. (2017). Present and future flood vulnerability, risk and disadvantage: A UK scale assessment. A report for the Joseph Rowntree Foundation published by Sayers and Partners LLP.
-
Sayers, P.B., Horritt, M., Penning Rowsell, E., and Fieth, J. (2017). Present and future flood vulnerability, risk and disadvantage: A UK scale assessment. A report for the Joseph Rowntree Foundation published by Sayers and Partners LLP.
-
Sayers, P.B., Horritt, M., Penning Rowsell, E., and Fieth, J. (2017). Present and future flood vulnerability, risk and disadvantage: A UK scale assessment. A report for the Joseph Rowntree Foundation published by Sayers and Partners LLP.
-
Sayers, P.B., Horritt, M., Penning Rowsell, E., and Fieth, J. (2017). Present and future flood vulnerability, risk and disadvantage: A UK scale assessment. A report for the Joseph Rowntree Foundation published by Sayers and Partners LLP.
-
Sayers, P.B., Horritt, M., Penning Rowsell, E., and Fieth, J. (2017). Present and future flood vulnerability, risk and disadvantage: A UK scale assessment. A report for the Joseph Rowntree Foundation published by Sayers and Partners LLP.
-
Sayers, P.B., Horritt, M., Penning Rowsell, E., and Fieth, J. (2017). Present and future flood vulnerability, risk and disadvantage: A UK scale assessment. A report for the Joseph Rowntree Foundation published by Sayers and Partners LLP.
-
Sayers, P.B., Horritt, M., Penning Rowsell, E., and Fieth, J. (2017). Present and future flood vulnerability, risk and disadvantage: A UK scale assessment. A report for the Joseph Rowntree Foundation published by Sayers and Partners LLP.
-
Sayers, P.B., Horritt, M., Penning Rowsell, E., and Fieth, J. (2017). Present and future flood vulnerability, risk and disadvantage: A UK scale assessment. A report for the Joseph Rowntree Foundation published by Sayers and Partners LLP.

Built by:
![]()
© 2014 - Climate Just
Contact us