There is an uneven distribution of climate disadvantaged neighbourhoods across the UK.


On this page:


Introduction


Some people and groups are more susceptible to the negative impacts of climate-related hazards due to their different abilities to deal with them. There are many studies of social vulnerability  and many causes which have been identified. Some of the factors affecting the potential for different impacts between people and places as a result of flooding and heatwaves are listed in Table 1, below. Studies have also been carried out for particular parts of the UK1 and for different types of climate-related events.2,3


Using maps to identify vulnerable people and places


This website provides new maps to show practitioners how different people and places are likely to be affected by flooding and high temperatures. Social vulnerability maps show places where the current characteristics of people and communities could result in negative impacts on their well-being from flooding or high temperatures. These maps are combined with others showing the potential to be exposed to flooding (in the present day) and high temperatures (in the 2050s). Combined maps - flood disadvantage and heat disadvantage - show how the likelihood of being affected compares with the potential for severe impacts on well-being in an area. 


Maps have been created using a new mapping framework applied to local neighbourhoods. Since this web resource was launched, the framework has been further developed for finer scale assessment of flood vulnerability and disadvantage across the whole of the UK25. Heat-related data have not been changed and are still only available for England via this resource (although analysis for the devolved nations for 2001 has been published separately). Users interested to access the coarser scale data of flood vulnerability and disadvantage in England for 2011 developed using the original framework can access our archived maps and related explanation. The rest of the material on flood vulnerability and disadvantage in the Which places are disadvantaged? section relates to the revised method and results for England, Scotland and Wales. Full documentation is available separately in the final report of the revised work26, including results for Northern Ireland. Maps for Northern Ireland are not available on this resource due to licence restrictions. The following text includes extracts of the final report, reproduced with the permission of the lead author.


Flood vulnerability and disadvantage neighbourhoods are quite small. The revised flood maps have been created using neighbourhoods which in 2011 represented around 1,600 people on average in England and Wales and around 800 people on average in Scotland.  


Heat vulnerability and disadvantage neighbourhoods are quite large. Currently available only for England, heat vulnerability and disadvantage maps have been created for neighbourhoods of around 7,800 people on average in 2011. This means that therefore some areas are not as well represented as others. These might include rural areas where the geographical zones are disproportionately large, or places where there are distinct contrasts in population or physical characteristics over relatively small areas. 


The map framework can be adapted and extended to suit local circumstances and data availability. Indeed, the maps should be seen as a starting point to support you through the process of identifying local geographical distributions of vulnerability and disadvantage and developing actions to respond.  

• See the video introduction with an explanation of how use the maps

• See the section on benefits and drawbacks of the maps for a full list of caveats to consider when using the maps provided. See Section 3, above, for more information about how vulnerability should really be recognised as a process, rather than a static characteristic. 


Much of the evidence used in the maps is already available, but it is often not provided in a form which helps develop an appreciation of the full range of factors driving negative effects on wellbeing in a local area, particularly those related to social causes. Traditional resource-based measures of well-being used by economists, for example, the loss of income or property values due to extreme weather, do not go far enough to capture the full range of losses and wider social impacts involved.4 Richer accounts of social vulnerability are available, but they tend to be qualitative and provide only one type of evidence that decision-makers need. Social deprivation indices have become the de facto means of measuring and mapping social vulnerability. While these indices have a role to play and contain many of the factors of interest, they do not include them all. As a result, practitioners and other decision-makers may miss out on developing responses to target those in most need and miss opportunities for taking action. 


Box 1: Foundations for the mapping work in this study

There is much debate about how to define and characterise social vulnerability and its connection to vulnerability more widely. According to the IPCC, vulnerability to climate change is: a function of the character, magnitude, and rate of climate variation to which a system is exposed, its sensitivity, and its adaptive capacity.1  On this website we distinguish vulnerability and climate disadvantage.  The concept of vulnerability is used to describe the capacities of individuals and social groups to respond to the impacts of adverse events. A useful characterisation of vulnerability is offered by Kelly and Adger:  ‘we define vulnerability in terms of the ability or inability of individuals and social groupings to respond to, in the sense of cope with, recover from or adapt to, any external stress placed on their livelihoods and well-being.2 Vulnerability is a matter of how external stresses impact on well-being. How vulnerable an individual or group will be to a climate related event depends upon not just their personal sensitivity to the event, but also the environmental and social factors that lead to losses in well-being. How far an individual or group is disadvantaged by a climate related event will depend on both their vulnerability and the degree to which they are exposed to the event.3
 

It is helpful to consider the adjustments required to avoid negative consequences of events in terms of what can be done before, during and after events to minimise impacts. These phases are more commonly considered in disaster management frameworks.4 but can be applied to climate adaptation and climate-related extreme weather.  They connect to the means of building community resilience.
 

Resilience and vulnerability are closely related to each other. A useful definition of social resilience is ‘the ability of groups or communities to cope with external stresses and disturbances as a result of social, political and environmental change.'5 Addressing the personal, environmental and social factors that affect the degree to which a community is vulnerable to a hazard such as flood, drought or heatwave will also address how well a community is able to bounce back after the impacts of the hazard. A community that is better able to prepare for, respond to and recover from external hazards like floods or heat waves will be more resilient to that hazard.  Building resilience needs to account for: the degree to which the community comes into contact with a hazard capable of causing harm; the amount of inherent susceptibility to harm in that community; and the extent to which people in the community are able to make adjustments in order to avoid negative consequences.
 

1. IPCC (2007) Climate Change 2007: Impacts, Adaptation, and Vulnerability. Contribution of Working Group II to the Fourth Assessment Report of the Intergovernmental Panel on Climate Change, Parry, M. L., Canziani, O. F., Palutikof, J. P., van der Linden, P. J. and Hanson, C. E. (eds). Cambridge: Cambridge University Press p. 883

2. Kelly, P. M. & Adger, W. N. (2000) Theory and Practice in Assessing Vulnerability to Climate Change and Facilitating Adaptation. Climatic Change, 47(4) 325-352.

3. Lindley, S. J., O’Neill, J., Kandeh, J., Lawson, N., Christian, R. & O’Neill M. (2011) “Climate change, justice and vulnerability”, Joseph Rowntree Foundation Report, York

4. ISDR International Strategy for Disaster Reduction (2005) Hyogo Framework for Action 2005-2015: Building the Resilience of Nations and Communities to Disasters

5. Adger, N. 2000, ‘Social and ecological resilience: are they related?’ Progress in Human Geography 24: pp. 347–364, page 347.


Social vulnerability


Social vulnerability comes about through the interaction of a number of personal, environmental and social factors that affect the way in which climate hazards impact on the well-being of individuals or groups:                                                                                                                                                                                                                                                                     

  • Personal features of the individual such as age and health;
  • Environmental characteristics such as the availability of green space, quality of housing stock or elevation of buildings;
  • Social and institutional context, such as levels of inequality and income, the strength of social networks, the cohesion of neighbourhoods and the day-to-day practices of institutions, such as care regimes in nursing homes. Social factors can be very influential on the outcomes of heatwave events, yet evidence suggests that the design of responses still tends to over-rely on assessments of people’s biophysical susceptibilities,i.e. their sensitivity.


Socio-spatial vulnerability to impacts of heat


Maps of socio-spatial vulnerability to heat are provided in the mapping tool showing how the personal, social and environmental factors which help to explain uneven impacts from extreme events like heatwaves come together in particular neighbourhoods. Vulnerability is measured through five dimensions (see Box 1):

  • Sensitivity – personal biophysical characteristics, such as age and health, which affect the likelihood that a heatwave event will have negative welfare impacts;
  • Enhanced exposure – the aspects of the physical environment, such as the availability of green space or housing characteristics, which tend to accentuate or offset the severity of heatwaves;
  • Ability to prepare – primarily the social factors that enable individuals or communities to prepare for heatwaves;
  • Ability to respond – primarily the social factors that enable individuals and communities to immediately respond to heatwaves, such as income, personal mobility, fear of crime and community networks;
  • Ability to recover – primarily the social factors that enable individuals and communities to recover from heatwaves, such as income, social networks and availability of hospital and GP services.6


Social vulnerability to impacts of flooding


Maps of social vulnerability to flooding are provided in the mapping tool showing how the personal, social and environmental factors which help to explain uneven impacts from extreme events like flooding come together in particular neighbourhoods. The new Neighbourhood Flood Vulnerability Index (NFVI)  provides insight into the social vulnerability of a neighbourhood should a flood occur. The NFVI combines five characteristics of vulnerability: 

  • Susceptibility - describing the predisposition of an individual to experience a loss of well-being when exposed to a flood.  It is widely evidenced that the dominant characteristics that influence susceptibility to harm relate to the age (the old and very young) and health of the individuals exposed.  
  • Ability to prepare - reflecting the actions taken by an individual during normal conditions (i.e. in the absence of a forecast or actual flood) that are likely to reduce the harm they suffer when a future flood occurs.  Although an area of continued research, an individual’s ability to prepare is influenced by their income, capacity to act, local knowledge and property tenure.
  • Ability to respond – reflecting the underlying reasons why some individuals act more effectively in the run up to and during a flood. Although this is an area of continued research, there is broad agreement that an individual’s ability to respond is influenced by their income, capacity to access and use formal and informal information, local knowledge and physical mobility.  
  • Ability to recover – reflecting the degree to which an individual can aid their own recovery is influenced by several factors, particularly their income, capacity to use information, and physical mobility. Many flood events have highlighted the length of time it can take for individuals and communities to recover from a flood.  
  • Community support – recognising how the availability and quality of services provided by health and emergency services as well as broader care and social services influence the severity of harm caused by a flood .  A formal representation of community cohesion and its influence on flood vulnerability is not available.  However, the following are considered to gauge the nature of this support: housing characteristics; the collective experience of past floods; the likely availability of community services in a flood (including emergency service provides, schools, GPs, care homes); and the social networks that exist. 


Climate disadvantage


Maps of climate disadvantage show how social vulnerability combines with the potential for exposure to hazards – current and future flood likelihood and patterns of high temperatures - in local neighbourhoods. Climate disadvantage can be estimated and mapped through the combination of representations of hazard-exposure and socio-spatial vulnerability.7 The relationships between the different datasets available in this resource for heat-related events are illustrated in Figure 1b, based on the overall conceptual framework in Figure 1a. The equivalent information for flood-related events is given in Figures 2b and 2a respectively.  


New flood disadvantage data for England, Scotland and Wales further develops the previous work available on this site. The Social Flood Risk Index (SFRI) is used “to identify where vulnerability and exposure coincide to create flood disadvantage” (p. i). The data are calculated at both neighbourhood (SFRI) and individual (iSFRI) levels. In the original work flood disadvantage was considered to be a ‘geographical’ phenomenon highlighting issues of distributional justice. This geographical interpretation has been retained in the revised data. However, ideas have also been further developed to consider ‘systemic’ disadvantage. This considers “the degree to which the most vulnerable neighbourhoods are disproportionally affected by flooding when compared to less vulnerable neighbourhoods”. The range of metrics used in the revised work is shown in Figure 3 with definitions given in Table 2 and key findings summarised in Section 3, above. Also see our SFRI Information Sheet for a more detailed description.


In addition to the present day, the revised data also consider future disadvantage. Future risks in relation to fluvial, coastal and surface water flooding are estimated for  the 2020s, 2050s and 2080s according to exogenous (external) and endogenous (internal) drivers of change. See our map tool to explore the data for the present day and for 2050s scenarios for a +2◦C and +4◦C rise in Global Mean Temperatures for fluvial/coastal and surface water flooding. Data for this purpose have been provided by the authors of the latest research , with further details, scenarios and other features of the revised work (including exposure metrics) explained in the full report and related technical user guide. There is also a new academic publication based on the research.


This website provides new information to support practitioners in the process of a broader and deeper consideration of social vulnerability and climate disadvantage at the local level. Data are available for 2011 for England, Scotland and Wales with respect to flooding and for England with respect to heat. Equivalent data for Scotland, Wales and Northern Ireland for 2001 for heat and flood (original method) can be found here8, and for Scotland only in this related research for the Scottish Government9. The information in the following sections and the associated map tool are provided to: 

  • Explain the aspects of well-being that are endangered by climate change but which are not yet adequately captured by existing approaches to adaptation policy
  • Outline the social dimensions of vulnerability to climate change which have not yet been sufficiently recognised in adaptation policy
  • Provide supporting evidence for building up local profiles of climate disadvantage and social vulnerability for your area
  • Illustrate the uneven geographical distributions in climate-related social vulnerability and climate disadvantage (see Section 3, above)
  • Show how factors can be represented and mapped to develop and extend the evidence provided in the resources.
  • Assist with the process of using the evidence to support local decision-making, including through encouraging a consideration of limitations in the data.


Figure 1a: Conceptual framework for assessing socio-spatial vulnerability and climate disadvantage (heat and original flood data)11


Figure 1b: The relationship between different datasets available in this resource: Climate disadvantage as a measure of socio-spatial vulnerability and hazard-exposure.


Figure 2a: New framework for assessing current and future flood disadvantage (top) considering exogenous (external) (middle) and endogenous (internal) (bottom) drivers. Also see Figure 2b for the structure of the vulnerability component.18


Figure 2b. The structure of the Neighbourhood Flood Vulnerability Index (NFVI)18


Influence

Factor

Heat/Flood

Sensitivity: (+) increasing susceptibility;(–) reducing susceptibility

Age: very young and elderly (+)

Both

Gender: women may be more likely to have caring responsibilities (+) men (esp. young) associated with risk-taking behaviour (+)

Both

Health status: illness (+)

Both

Physical and mental health problems (+)

Both

Residential care homes (+)

Both

Neighbourhood characteristics (+/–)

Both

Exposure: (+) enhancing; (–) offsetting

Basement, single storey and mobile housing (+)

Flood

Homeless, tourists, transients (+)

Both

Location (+/–)

Both

Overcrowding (+) high housing density (+)

Both

Thermo-insulate housing: air conditioning (–)

Heat

Top-floor flats (+)

Heat

Unventilated buildings (+)

Heat

Urban dwellers (+) living in city centre (+) land cover (+/), green space (–), access to parks and green spaces (–)

Both

Adaptive capacity: (+) reducing ability to adapt; (–) increasing ability to adapt

Access to decision making: increased access (–)

Both

Access to medical establishments (–)

Heat

Awareness and preparedness: high awareness (–)

Both

Density of medical establishments and services ( higher –)

Heat

Density and access to air-conditioned environments outside the home (–)

Heat

Disability, e.g. lack of mobility (+)

Both

Educational attainment (poor +)

Both

Family/household composition: large families (+), single parents (+), single-person households (+)

Both

Flood experience: no experience (+)

Flood

Income (low +)

Both

Insurance accessibility (good –)

Flood

Length of residence, linked to prior experience: short residence (+)

Both

Mobility: lack of transportation (+)

Both

Occupation: skilled (–) or unskilled (+), also linked to income and financial status

Both

Proportion of minority ethnic groups and new migrants/visitors, e.g. due to potential language issues (+) high population turnover (+)

Both

Resources available to local authorities (+/–)

Both

Serviced by flood warning system: yes (–), no (+)

Flood

Skills and access to technology, e.g. access to environmental information (lack +)

Both

Social isolation (+)

Both

Socio-economic status (+/–)

Both

Social deprivation (high +)

Both

Tenancy characteristics: Renters (+), homeowners (–)

Both

Trust in authorities: no (+), yes (–)

Both

Unemployment (+)

Both

Table 1: Factors determining uneven impacts to the same climate-related event. Divided into three broad groups: sensitivity, exposure and adaptive capacity.11,12,13


Figure 3: Metrics used in the new social flood vulnerability and disadvantage research18. The new maps available in this resource relate to the Neighbourhood Flood Vulnerability Index (NFVI) and Social Flood Risk Index (SFRI). Key findings for these and other metrics are summarised in Section 3, above. See the full report for further explanation of methods and further detail on findings for the full range of metrics. Definitions are given in Table 2 below. 


Metric

Insight provided

Exposure metrics

Floodplain population (FP)

The scale of the potential exposure within a neighbourhood in the absence of defences.

Expected Annual Probability of flooding: Individual (EAI)

An individual’s annual ‘average’ exposure to flooding, taking account of defences. Athough not representative of any specific individual this provides a means of comparing the ‘average’ exposure between neighbourhoods.

Number of People Exposed to Frequent Flooding (PEFf)

The number of people exposed to flooding more frequently than 1:75 years, on average.

Vulnerability metrics

Neighbourhood Flood Vulnerability Index (NFVI)

The propensity of those living in a neighbourhood to suffer a loss of well-being should a flood occur.

Risk metrics

Expected Annual Damages (EAD) - Residential only

The annual ‘average’ direct economic damages, in monetary terms, taking account of defences.


This provides the conventional view of risk that estimates the Expected Annual Damages in national economic terms.

Expected Annual Damage: Individual (EADi)

The average (economic) risk faced by an individual living within the floodplain.  Although not representative of the risk faced by any specific individual this provides a means of comparing risks between neighbourhoods.

Relative Economic Pain (REP)

The ‘relative pain’ of the economic risks faced by those exposed to flooding (expressed as the ratio between uninsured economic damages and household income).


REP = (1- insurance penetration) x Expected Annual Damages (direct residential) per household within the floodplain / Average income per household within the neighbourhood.

Social Flood Risk Index (SFRI - also see the Information Sheet for more detail)

The level of social flood risk (a combination of exposure, vulnerability and probability of flooding), at a neighbourhood scale (SFRI) and as an individual ‘average’ (iSFRI).


SFRI Group = Expected Annual Probability of Flooding: Individual (EAI) x Number of people within the floodplain (FP) x Neighbourhood Flood Vulnerability Index (NFVI).


SFRI Individual = Expected Annual Probability of Flooding: Individual (EAI) x Neighbourhood Flood Vulnerability Index (NFVI).

Table 2: Vulnerability and risk metrics used to determine the degree of social flood resilience in revised work on social vulnerability and climate disadvantage with respect to flooding18. Also see the separate technical user guide


Back to the top


References

  1. Zsamboky, M., Fernandez-Bilbao, A., Smith, D., Knight, J. & Allan, J. (2011) “Impacts of climate change on disadvantaged UK coastal communities”, Joseph Rowntree Foundation, York.
  2. Houston, D., Werritty, A., Bassett, D., Geddes, A., Hoolachan, A. & McMillan, M. (2011) “Pluvial (rain-related) flooding in urban areas : the invisible hazard”, Joseph Rowntree Foundation, York.
  3. Benzie, M, Harvey, A, Burningham, K, Hodgson, N and Siddiqi, A (2011) Vulnerability to heatwaves and drought: adaptation to climate change, JRF.
  4. Lindley, S., O’Neill, J., Kandeh, J., Lawson, N., Christian, R. & O’Neill M. (2011) “Climate change, justice and vulnerability”, Joseph Rowntree Foundation Report, York.
  5. Benzie, M, Harvey, A, Burningham, K, Hodgson, N and Siddiqi, A (2011) Vulnerability to heatwaves and drought: adaptation to climate change, JRF.
  6. Lindley, S., O’Neill, J., Kandeh, J., Lawson, N., Christian, R. & O’Neill M. (2011) “Climate change, justice and vulnerability”, Joseph Rowntree Foundation Report, York.
  7. Lindley, S., O’Neill, J., Kandeh, J., Lawson, N., Christian, R. & O’Neill M. (2011) “Climate change, justice and vulnerability”, Joseph Rowntree Foundation Report, York.
  8. Lindley, S., O’Neill, J., Kandeh, J., Lawson, N., Christian, R. & O’Neill M. (2011) “Climate change, justice and vulnerability”, Joseph Rowntree Foundation Report, York.
  9. References Lindley, S. J. & O’Neill, J. (2013) Flood disadvantage in Scotland: mapping the potential losses in well-being. Scottish Government Social Research.
  10. Lindley, S., O’Neill, J., Kandeh, J., Lawson, N., Christian, R. & O’Neill M. (2011) “Climate change, justice and vulnerability”, Joseph Rowntree Foundation Report, York.
  11. McGregor, G. R., Pelling, M., Wolf, T. and Gosling, S. (2007) The Social Impacts of Heatwaves, Science Report – SC20061/SR6. Environment Agency.
  12. Tapsell, S. M., Tunstall, S. M., Green, C. and Fernandez, A. (2005) Indicator set. Report T11-07-01 of FLOODsite Integrated Project, Flood Hazard Research Centre, Enfield.  [Accessed 29 September 2011] Tapsall, et al., 2005.
  13. Cutter, S. L., Emrich, C. T., Webb, J. J. and Morath, D. (2009) Social Vulnerability to Climate Variability Hazards: A Review of the Literature. Hazards and Vulnerability Research Institute, University of South Carolina, Columbia.
  14. Sayers, P.B., Horritt, M., Penning Rowsell, E., and Fieth, J. (2017). Present and future flood vulnerability, risk and disadvantage: A UK scale assessment. A report for the Joseph Rowntree Foundation published by Sayers and Partners LLP.

  15. Sayers, P.B., Horritt, M., Penning Rowsell, E., and Fieth, J. (2017). Present and future flood vulnerability, risk and disadvantage: A UK scale assessment. A report for the Joseph Rowntree Foundation published by Sayers and Partners LLP.

  16. Sayers, P.B., Horritt, M., Penning Rowsell, E., and Fieth, J. (2017). Present and future flood vulnerability, risk and disadvantage: A UK scale assessment. A report for the Joseph Rowntree Foundation published by Sayers and Partners LLP.

  17. National Flood Community Resilience Pathfinders schemes, Defra, 2012, 2015. Defra (2012). Flood Resilience Community Pathfinder Prospectus  Defra (2012b) UK Climate Change Risk Assessment Evidence Report. Defra, 2015 Flood Resilience Community Pathfinder Evaluation Final Evaluation Report October 2015.

  18. Sayers, P.B., Horritt, M., Penning Rowsell, E., and Fieth, J. (2017). Present and future flood vulnerability, risk and disadvantage: A UK scale assessment. A report for the Joseph Rowntree Foundation published by Sayers and Partners LLP.

  19. Sayers, P.B., Horritt, M., Penning Rowsell, E., and Fieth, J. (2017). Present and future flood vulnerability, risk and disadvantage: A UK scale assessment. A report for the Joseph Rowntree Foundation published by Sayers and Partners LLP.

  20. Sayers, P.B., Horritt, M., Penning Rowsell, E., and Fieth, J. (2017). Present and future flood vulnerability, risk and disadvantage: A UK scale assessment. A report for the Joseph Rowntree Foundation published by Sayers and Partners LLP.

  21. Sayers, P.B., Horritt, M., Penning Rowsell, E., and Fieth, J. (2017). Present and future flood vulnerability, risk and disadvantage: A UK scale assessment. A report for the Joseph Rowntree Foundation published by Sayers and Partners LLP.

  22. Sayers, P.B., Horritt, M., Penning Rowsell, E., and Fieth, J. (2017). Present and future flood vulnerability, risk and disadvantage: A UK scale assessment. A report for the Joseph Rowntree Foundation published by Sayers and Partners LLP.

  23. Sayers, P.B., Horritt, M., Penning Rowsell, E., and Fieth, J. (2017). Present and future flood vulnerability, risk and disadvantage: A UK scale assessment. A report for the Joseph Rowntree Foundation published by Sayers and Partners LLP.

  24. Sayers, P.B., Horritt, M., Penning Rowsell, E., and Fieth, J. (2017). Present and future flood vulnerability, risk and disadvantage: A UK scale assessment. A report for the Joseph Rowntree Foundation published by Sayers and Partners LLP.

  25. Sayers, P.B., Horritt, M., Penning Rowsell, E., and Fieth, J. (2017). Present and future flood vulnerability, risk and disadvantage: A UK scale assessment. A report for the Joseph Rowntree Foundation published by Sayers and Partners LLP.

  26. Sayers, P.B., Horritt, M., Penning Rowsell, E., and Fieth, J. (2017). Present and future flood vulnerability, risk and disadvantage: A UK scale assessment. A report for the Joseph Rowntree Foundation published by Sayers and Partners LLP.


Mapping the social causes of uneven impacts from climate change and extreme weather and mapping patterns of potential exposure need to be given equal emphasis


On this page:


The need to consider social factors

Much effort has gone into providing local decision-makers with supporting evidence concerning the geographical patterns of potential exposure to climate-related events, particularly flooding. While this is important, much less attention has been paid to providing equivalent supporting evidence concerning the other factors which explain why one community can have a very different health and wellbeing outcome than another even when exposed to the same event. This has restricted the development and implementation of local responses which address the specific social, personal and environmental factors that render people more or less vulnerable to losses in well-being.


The Climate Just website provides map resources to help you to consider social factors in your local adaptation planning. Evidence from past UK flooding and heat wave events are used to measure socio-spatial vulnerabilities and map geographical distributions of climate disadvantage. A greater consideration of the causes of uneven impacts can also help you to make your adaptation plans more socially just.


Social deprivation is often used as a proxy for social vulnerability and there is evidence of a link between deprivation and exposure to hazards. A study in 2006 looked at the association between Environment Agency flood risk zones and the proportion of the population within them classified as being deprived. Although no clear trend was found for river-related flooding, for coastal flooding the most deprived people were more likely to live in exposed areas compared to the least deprived (Figure 4). In a separate study, slightly higher proportions of deprived communities were also found to be located in areas likely to be exposed to particularly intense rainfall and therefore surface water flood events.1


Figure 4: Deprivation and coastal flooding: Percentage of England’s total population living within zones 2 (between a 1 in 200 and 1 in 1,000 annual probability of sea flooding) and 3 (1 in 200 of greater annual probability of coastal flooding) by deprivation decile.2


Social deprivation indices do not capture the full range of factors affecting impacts on people’s wellbeing from events like floods and heat waves. For example, although many of the 38 indicators used in the English Index of Multiple Deprivation 20103 cover some of the same themes (such as income, education, access to services, health and crime), they do not include:

  • Age, other than the Income Deprivation Affecting Older People Index;
  • Tenure, other than Social and private housing in poor condition and Difficulty of access to owner-occupation;
  • Building or local environment characteristics specifically linked to higher exposure levels, such as building elevation or the amount of greenspace;
  • Social networks and isolation, either directly or by proxy;
  • Past flooding events or potential for insurance access problems;
  • Mobility, other than personal disability.

Despite their limitations for understanding impacts and responses, social deprivation indices are still a mainstay of national government evidence building. Flood Risk Management policy typically considers vulnerability through the lens of deprivation (as indicated by the Index of Multiple Deprivation) and this view provided the basis of the analysis presented in the Climate Change Risk Assessment15,16.


The vulnerability of an area is a cause for concern in itself as it suggests that the wellbeing of the community living there could be improved. Many aspects of vulnerability are not hazard specific. Social isolation, low income, the absence of voice and lack of insurance will render individuals vulnerable when facing other pressures too (e.g. loss of employment, illness, theft or burglary). However, for vulnerability to climate change to translate into welfare losses, the area where vulnerable people live clearly needs to be exposed to a climate hazard, like a flood or heat-wave.


Duties and responsibilities


In preparing for climate change and extreme weather events, the need to account for social vulnerability is becoming increasing recognised in guidance and legislation. It is linked with wider sustainability goals and therefore relevant across the framework of current legislation. Addressing issues associated with social vulnerability can therefore be either an explicit or implicit requirement for authorities and their partners in service delivery. The sections below focus on England, but the same broad issues are recognised in Scotland and Wales.


Local authorities and their partners in service delivery have statutory duties and other responsibilities in relation to:

  • Flood and Water Management Act (FWMA) 2010 The Flood & Coastal Erosion Risk Management (FCERM)4 strategy for implementing the Act sets out guiding principles. Sustainability is a central theme, following the strong public support (96%) identified at the draft bill stage.5 The strategy also highlights that some individual elements, such as the national capital allocation system, should consider both flood risk and also how far those affected are able to help themselves, in other words taking account of how much adaptive capacity is already within a community.  Guidance for risk management authorities sets out how sustainable development should be brought into decision-making in the context of flood and coastal erosion risk management. This includes:  
  • taking account of the safety and wellbeing of people and the ecosystems upon which they depend,
  • taking action to avoid exposing current and future generations to increasing risk
  • improving the resilience of communities, the economy and the natural, historic, built and social environment to current and future risks.6


The guidance also identifies Well-being and Social Justice as a theme, namely to ‘ensure that FCERM activities continue to contribute to community well-being and address issues of social justice’.7  Defra’s recent (2011)8 guidance for mainstreaming the government’s sustainable development vision into practice recognises the need to account for the social dimensions of policies and reiterates that a key part of Government’s agenda is a focus on fairness and wellbeing.  Defra’s earlier policy statement on the appraisal of flood and coastal erosion risk management spells out some of the social justice issues to consider (Table 3). This stresses the need to fully consider social vulnerability alongside some of the other social justice themes covered in this resource.  


Broad Principles

Rationale

All impacts of different policy and investment options should be recognised in appraisal and where possible valued.

To ensure that no preferential treatment is given to certain types of costs or benefits which may accrue to different groups in society.

Costs and benefits should be disaggregated so that it is clear which sections of society are paying for and gaining from different options.

To seek contributions from private beneficiaries. To ensure that the poorest members of society are not indirectly subsidising wealthier beneficiaries

Distributional adjustments should be made, where appropriate, in line with official guidance.

To better understand whether there is evidence that the marginal utility of an extra pound to a poorer person is higher than that of a richer person in an appraisal area or across a catchment or shoreline, or across wider programme.

Capping or decision rules should be considered and applied consistently.

To ensure that a disproportionate level of benefit does not accrue in specific properties when benefits could be spread more fairly and efficiently across wider number of beneficiaries.

Vulnerability of people should be considered in appraisal including vulnerability to residual risks: e.g. where benefits may arise via flood warning, adaptation and resilience measures.

To ensure that social justice relates to not only the less wealthy, but also those who may be vulnerable to the risks, such as the elderly.

Procedural justice should be considered throughout.

To ensure fair and equitable access to the decision making process. Good stakeholder engagement and governance, as part of appraisal, are important aspects.

From time to time Government may set targets to encourage the delivery of flood and erosion risk management to specific sections of society for reasons of social justice.

To influence fairness through target setting across the programme. For example, the target for the current period which relates to reducing the risk in the most deprived areas.

Table 3. Principles to ensure a strong, healthy and just society.9


  • Health and Social Care Act 2012 puts local authorities at the centre of activities to improve health and to bring together the work of the NHS with that carried out by organisations involved in providing social care, housing, environmental health, leisure and transport services.  Important instruments for joining up actions to address climate risks and extreme weather events are the Joint Strategic Needs Assessments (JSNAs) and the associated strategies produced by Health and Wellbeing Boards. Tackling inequalities is central to the Act and many factors are also associated with aspects of social vulnerability:
    • population level demography – age, gender, ethnicity, population; growth and migration flows;
    • social, economic and environmental determinants  of health – housing quality, environment, employment,  educational attainment, benefit  uptake, crime, community  cohesion, and community assets such as libraries;
    • behavioural determinants of  health – exercise, smoking,  diet, alcohol and drug use, immunisation uptake.


  • The Equality Act 2010 allows for positive action in favour of people in groups with protected characteristics.10 Protected characteristics include disabilities defined as “physical or mental impairment that has a ‘substantial’ and ‘long-term’ negative effect” on normal day-to-day tasks”.11
  • The Civil Contingencies Act 2004 identifies local authorities, along with the emergency services and NHS bodies as the key organisations who have a responsibility for developing plans for emergency situations. They need to work with other organisations in local resilience fora to develop responses to support civil protection.
  • Action on reducing health and social inequalities is central to the Sustainable Development Unit for NHS England and Public Health England’s recent Sustainable Development Strategy12. The strategy is an important reference point for actions in relation to statutory responses. The SDU also provides additional guidance on statutory and policy drivers for action.13
  • The Heatwave Plan for England14 is non-statutory but provides a basis through which other obligations to produce adaptation plans can be developed. The main purpose is to provide information which helps in the process of building more resilient communities to heatwaves. It does this through setting out ways to prepare for heatwave events and what to do to avoid some of the most severe impacts from prolonged exposure to high temperatures.  Raising awareness among the wider public – especially sensitive groups - is one important goal but there are other actions which are also recommended for organisations whose role is likely to have an influence, such as the NHS, local authorities, public agencies and a range of organisations working with sensitive and vulnerable groups. According to the plan it is the role of local NHS, public health and social care organisations to oversee the care associated with people with particular susceptibilities, to help reduce the potential for over-exposure and to help ensure that associated service provision is sufficiently resilient to cope with the challenges associated with heatwave events. There is an equivalent plan for cold weather events.


Back to the top


References

  1. Houston, D., Werritty, A., Bassett, D., Geddes, A., Hoolachan, A. & McMillan, M. (2011) “Pluvial ( rain-related ) flooding in urban areas : the invisible hazard”, Joseph Rowntree Foundation, York.
  2. Walker, G., Burningham, K., Fielding, J., Smith, G., Thrush, D. & Fay, H. (2006) “Using science to create a better place: Addressing Environmental Inequalities: Flood Risk”, Science Report: SC020061/SR1, Environment Agency, Bristol.
  3. DCLG (2011) The English Indices of Deprivation 2010 Neighbourhoods. Statistical Release. Last accessed May 2014.
  4. Defra and the Environment Agency (2011) Understanding the risks, empowering communities, building resilience: The national flood and coastal erosion risk management strategy for England.
  5. Defra (2011a) Guidance for risk management authorities on sustainable development in relation to their flood and coastal erosion risk management functions.
  6. Defra (2011a) Guidance for risk management authorities on sustainable development in relation to their flood and coastal erosion risk management functions.
  7. Defra (2011a) Guidance for risk management authorities on sustainable development in relation to their flood and coastal erosion risk management functions. Page 28.
  8. Defra (2011b) Mainstreaming sustainable development – The Government’s vision and what this means in practice. Last accessed May 2014.
  9. Defra (2009) Appraisal of flood and coastal erosion risk management: A Defra policy statement (June 2009). Last accessed May 2014.
  10. Gov.uk Discrimination: your rights. Last accessed May 2014.
  11. Gov.uk Definition of disability under the Equality Act 2010. Last accessed May 2014
  12. Public Health England and the Sustainable Development Unit for NHS England (2014) Sustainable, Resilient, Healthy People & Places A Sustainable Development Strategy for the NHS, Public Health and Social Care syste
  13. Public Health England and the Sustainable Development Unit for NHS England (2014) Statutory and Policy Drivers for Change presentation.
  14. Heatwave Plan for England 2013
  15. Sayers, P.B., Horritt, M.  S., Penning-Rowsell, E., and Mckenzie, A.  (2015).  Climate Change Risk Assessment 2017: Projections of future flood risk in the UK.  Pages 125.  Sayers and Partners LLP report for the Committee on Climate Change.

  16. Sayers, P.B., Horritt, M., Penning Rowsell, E., and Fieth, J. (2017). Present and future flood vulnerability, risk and disadvantage: A UK scale assessment. A report for the Joseph Rowntree Foundation published by Sayers and Partners LLP


There is an uneven distribution of climate disadvantaged neighbourhoods across the UK.


On this page:


Overall geographic patterns


Previous mapping work conducted between 2010 and 2015 identified a series of geographical patterns associated with socio-spatial vulnerability and climate disadvantage.  The work emphasised the heightened vulnerability and disadvantage associated with urban and coastal areas. These patterns are still relevant in the finer-scale work on flood vulnerability and disadvantage published more recently17. However, the revised data provide additional insights, as are outlined in the text below. Furthermore, social vulnerability and disadvantage with respect to flooding have now been analysed in different ways and for different areas. Firstly, social vulnerability to flooding has been analysed in relation to investment in flood defences and development in floodplains. Secondly, findings are reported for urban and rural areas and other useful geographical units, such as ‘cities in decline’. Finally, results are given for future trends in flood disadvantage, including considering the impacts of climate change.


Headlines associated with social vulnerability and climate disadvantage for the UK are shown below.  They are grouped into flooding (based on revised data) and high temperatures (based on the original data). The new, finer scale social vulnerability and disadvantage data for flooding are available in our map tool for England, Scotland and Wales. A summary of key findings from the new work on flood disadvantage is available to supplement the materials shown online. The text below has been supplied by the authors of the associated report17 and material is reproduced with their permission. Headlines for social vulnerability and heat disadvantage for England (shown below) are as in the original version of this site. Headlines for the original version of the socio-spatial flood vulnerability and flood disadvantage data are archived separately as are the original maps of socio-spatial flood vulnerability and flood disadvantage.


It is important to remember that the statements relate to relatively broad trends at the national and regional levels. Even in areas that do not have high overall levels of social vulnerability and climate disadvantage there may still be pockets where this is high. In developing local responses to climate-related hazards and climate change adaptation plans it is crucial to identify local patterns of vulnerability and disadvantage. See the map tool to identify the vulnerability and disadvantage in your local area and the information on potential actions (4 and 5 above). The factors associated with the maps are outlined in the User Guide for both flood-related data and heat-related data, with more information given in the explanations in the map tool itself. Further information on key terms and what they mean is given in Section 1, above.


Flooding


Floodplain population, social vulnerability and exposure to frequent flooding

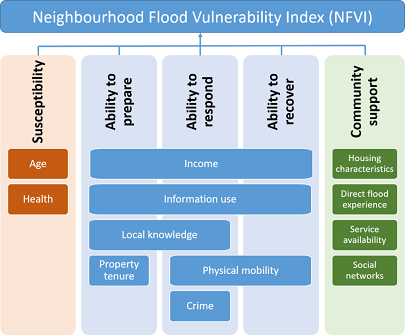
The most socially vulnerable neighbourhoods are over-represented in areas prone to flooding (all sources), but most significantly in areas prone to coastal (and tidal) flooding. Today approximately 6.4 million people live in flood prone areas, with around 1.5 million (or 23.4% of these people), living in the 20% most vulnerable neighbourhoods. Within all neighbourhoods, 31% (2 million people) are exposed to frequent flooding from either fluvial (river), coastal or surface water sources (with a return period of 1:75 years or more frequent). Of those, 6.1% live within the 5% most flood vulnerable neighbourhoods (ranked in the top 5% by Neighbourhood Vulnerability Index (NFVI), a measure of the propensity of those that live in a neighbourhood to experience a loss of well-being should a flood occur). This is a factor of 1.2 (20%) higher than would be expected (assuming exposure to flooding to be equally distributed between more and less vulnerable neighbourhoods). Of the 1.8 million people living in the coastal floodplain, 33% are within the 20% most vulnerable neighbourhoods and 10% in the 5% most vulnerable neighbourhoods (top 5% by NFVI). This is a significant over-representation. The current distribution of population living on the flood plain is shown in Figure 6.


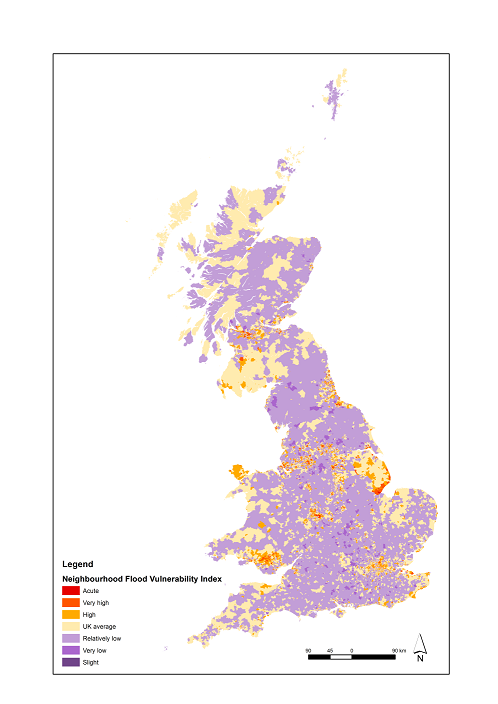
Figure 5: Neighbourhood Flood Vulnerability Index – distribution of social vulnerability to flooding (see the map tool for an interactive version).


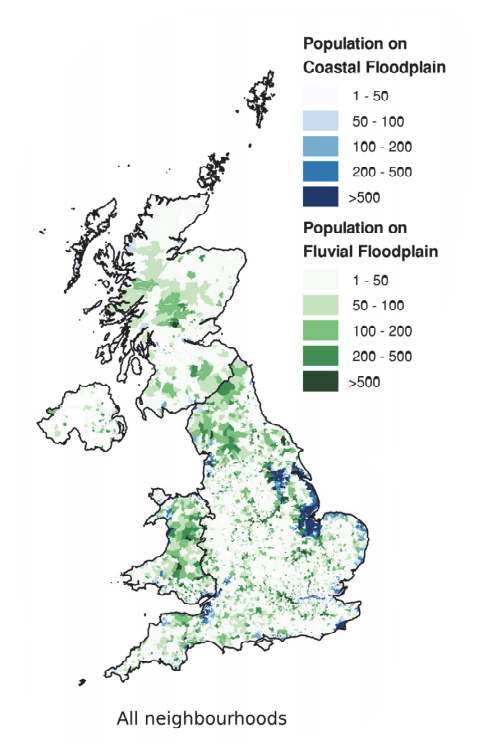
Figure 6: Present day: Concentration of people living in the floodplain17


The proportion of people living in the most socially vulnerable neighbourhoods is much greater in Northern Ireland than elsewhere in the UK. In Northern Ireland 55% of the population exposed to flooding live in the top 20% of neighbourhoods by NFVI (almost double the UK average) and 25% of the total population exposed to frequent flooding are in the 5% most vulnerable neighbourhoods (almost five times the UK average); with the most significant disadvantage seen in Belfast (a finding that also reflects the higher levels of poverty that exist in Northern Ireland compared to other parts of the UK).


Over 50% of those exposed to flooding and living in the most socially vulnerable neighbourhoods are in just ten local authorities. Seventy-five local authorities (approximately one fifth of the UK total) account for 50% of those living in flood prone areas. The concentration becomes more marked when the most vulnerable neighbourhoods (top 5% socially vulnerable by NFVI) are considered, with over 50% of people exposed to flooding in the most vulnerable neighbourhoods located in just ten local authorities (Hull, Boston, Belfast, Birmingham, East Lindsey, Glasgow, Leicester, North East Lincolnshire, Swale District, and Tower Hamlets).


By the 2080s more and less vulnerable neighbourhoods will both experience more frequent floods. The number of people living in flood prone areas is set to increase by 45% to 10.8 million people by the 2080s, assuming high population growth.  Combined with a +4oC climate future, and assuming current approaches to adaptation continue, 6.4 million people will be exposed to frequent flooding, up from 2 million today (an increase of over 200%).  In the most vulnerable neighbourhoods the increase is equally dramatic, again more than trebling, from 451,000 today to 1.4 million by the 2080s (an increase of over 200%).  The greatest increases are experienced in England and in areas prone to surface water and fluvial flooding. 


Expected Annual Damage (EAD) and the influence of income and insurance


At a UK scale EAD is dominated by England, but from the perspective of the most vulnerable neighbourhoods the contribution from other nations is greater. Residential EAD from flooding across the UK is £351 million (residential property only). These headline figures also mask the disproportional risks faced by vulnerable communities in all four nations. In England and Northern Ireland, the average EAD per person is highest in the most vulnerable neighbourhoods. The current distribution of EAD is shown in Figure 7 below.

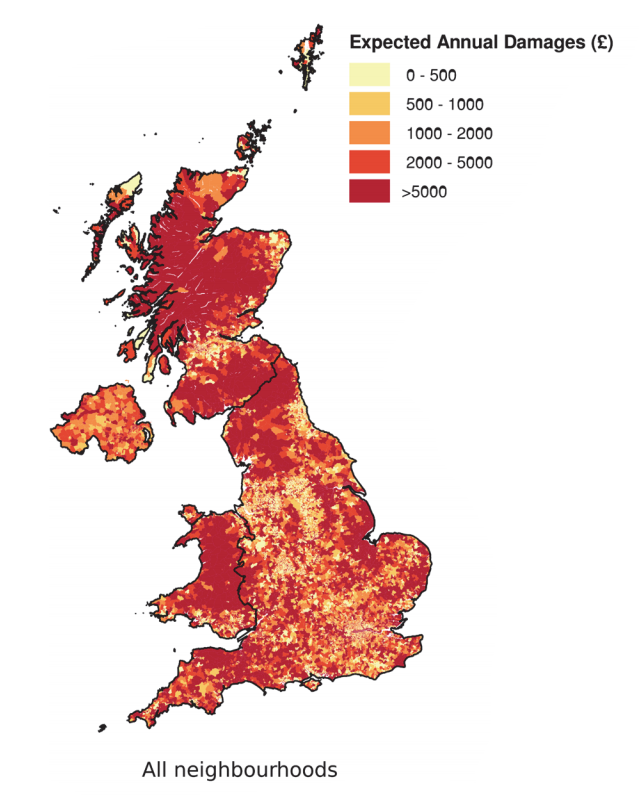
Figure 7: Present day: Spatial distribution of Expected Annual Damages (EAD)17


Today, vulnerable neighbourhoods contribute two-thirds of the EAD in Northern Ireland, but their future contribution raises fastest in Scotland. In Northern Ireland, the 20% most vulnerable neighbourhoods account for 67% of the EAD (in Scotland the equivalent figure is 22%, in England 22% and Wales 26%). This reflects a significant contribution from Belfast. Those living in flood prone areas in Scotland experience the highest EAD per person (on average, £113 per person); this is over double that of England (on average, £50 per person). By the 2080s (assuming a +4oC climate future and high population growth) the EAD per person in Scotland increases to £183 per person (compared to £95 per person in England) with the risk in the most vulnerable neighbourhoods (top 20% by NFVI) increasing twice as quickly as elsewhere (increasing from £93 to £206 per person). This is not the case in England, Wales and Northern Ireland where more and less vulnerable neighbourhoods experience a similar rate of increase in EAD per person.


At the coast, the most vulnerable neighbourhoods experience disproportionally high levels of EAD, today and in the future. At the coast, the 5% most vulnerable neighbourhoods account for 10% of the EAD; the 10% most vulnerable contribute 19% and the 20% most vulnerable 32%.  This implies that the risk experienced by the most vulnerable communities is much higher than the average; a disproportionality that persists into the future.


Lower income and lower levels of insurance penetration heighten the ‘relative economic pain’ (REP) of flooding in vulnerable neighbourhoods (across all sources of flooding). Low incomes and low levels of insurance penetration means the REP associated with flooding is much greater in socially vulnerable neighbourhoods than elsewhere.  In areas prone to coastal/tidal flooding, for example, the most vulnerable neighbourhoods (top 5% socially vulnerable by NFVI) experience over twice the REP of less vulnerable neighbourhoods; in fluvial floodplains, it is three times higher. 


EAD (residential direct damages only) is set to rise, from £351 million today, to £1.1 billion by the 2080s. By the 2080s (under all scenarios) the increase in the EAD metric tranates to significant increases in the REP across the UK and all sources of flooding, particularly for the most vulnerable neighbourhoods.


Urban and rural influences on flood disadvantage


At a UK scale, many socially vulnerable people live in urban areas prone to flooding, however vulnerable people living in rural settings are often exposed to more frequent flooding (and hence, on average, higher levels of EAD per person).People living in more vulnerable neighbourhoods in the fluvial and coastal floodplains are mostly in urban settings (840,000, over 90% of the total 900,000 of the people exposed to flooding in more vulnerable neighbourhoods). The remaining 60,000 in rural settings are exposed to more frequent flooding (reflected in an EAD per person, on average, of £76 compared to £42 in urban settings). 


By the 2080s, all neighbourhoods experience significant increases in EAD, with the most vulnerable neighbourhoods in more dispersed settings (both urban and rural) experiencing ightly greater increases than elsewhere. By the 2080s, assuming a continuation of current levels of adaptation, there is a significant increase in risk across all settlement types.  In many settings, more and less vulnerable neighbourhoods experience similar increases.  In dispersed urban and rural settings however, the most vulnerable neighbourhoods experience ightly higher percentage increases in risk when compared to less vulnerable neighbourhoods.


Local authorities and flood disadvantage


Clusters of high social flood risk exist in local authorities across the UK. The Social Flood Risk Index (SFRI) provides the most direct measure of flood disadvantage (where exposure to flood risk and social vulnerability coincide). It highlights Hull, Boston, Belfast, East Lindsey, Glasgow, Swale, Newham, Leicester, Shepway, North East Lincolnshire, and Birmingham as the ten most flood disadvantaged local authorities in UK. The current distribution of SFRI is shown in Figure 8 below (see the map tool for an interactive version).

Figure 8: Present day: Social flood risk index (SFRI)


Figure 8b. SFRI for river and coastal flooding using the refined legend in the map tool 

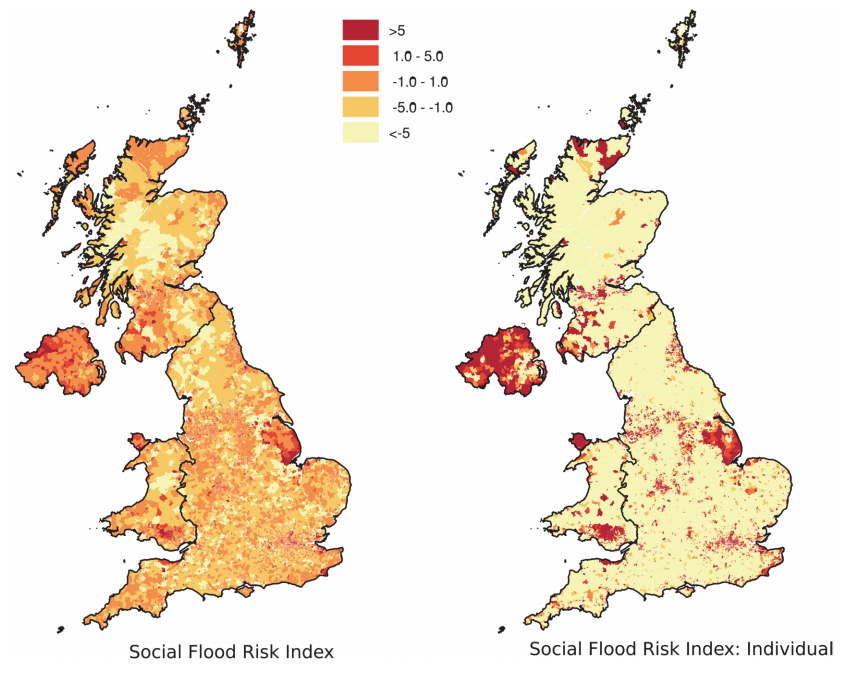
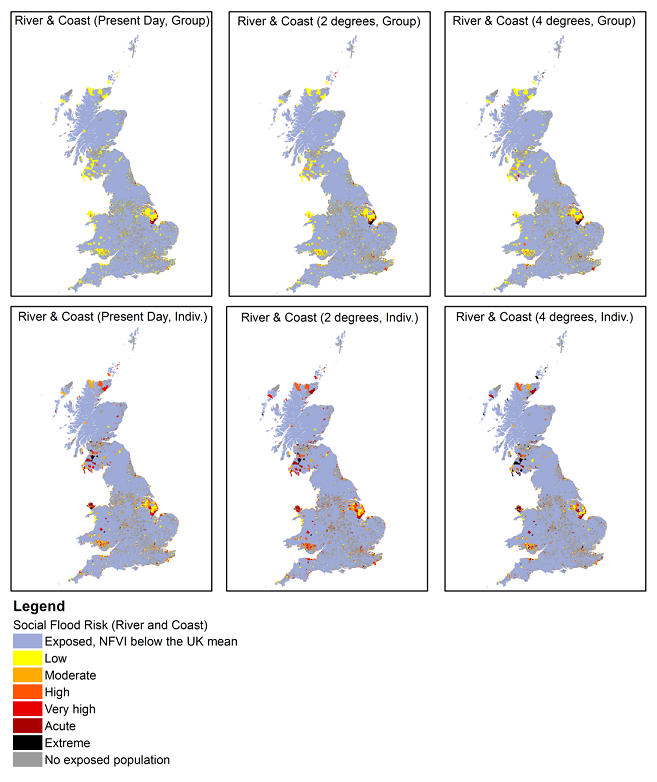
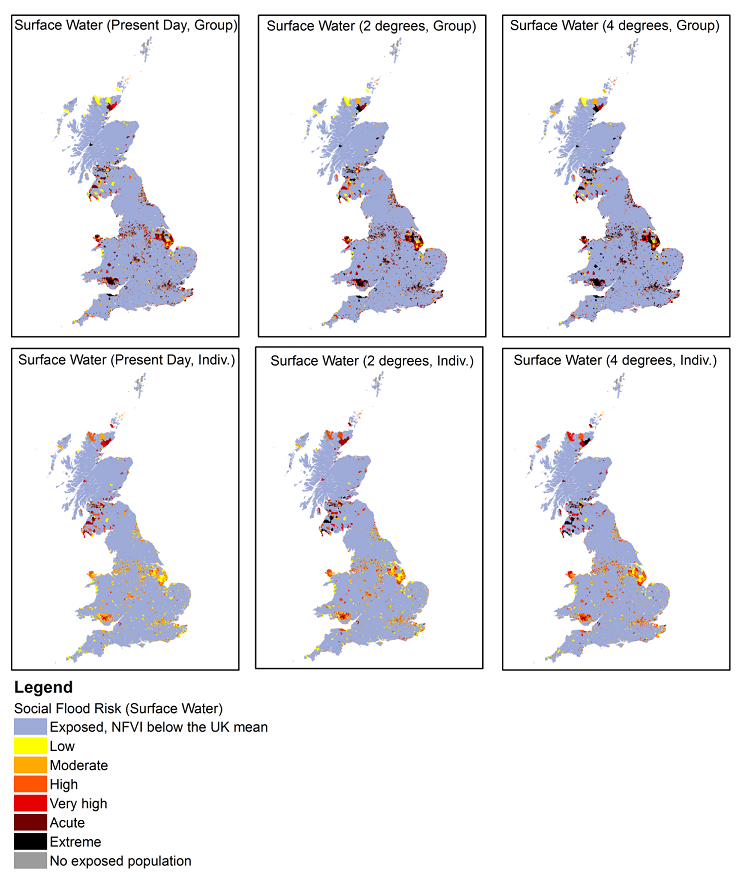
Figure 8c. SFRI for surface water flooding using the refined legend in the map tool 


In some cases, flood disadvantage is highly localised, in others it is widespread. Flood disadvantage typically reflects areas where a large number of vulnerable people are exposed to flooding (such as in Hull). In such situations, conventional flood defences are more likely to be feasible (technically and economically). Elsewhere, however, flood disadvantage may be highly localised and reflect the exposure of a small number of vulnerable people to frequent flooding. When considered from this perspective, other areas emerge as experiencing high levels of disadvantage, such as West Somerset, for example, where highly localised (individual and community based) approaches may be needed to manage flood risks. 

In most cases, local authorities that experience the highest level of flood disadvantage today continue to do so in the future.  There are however several exceptions where the increase is much faster than elsewhere. Across the Highlands of Scotland, Cardiff, Enfield, North Somerset, Tower Hamlets and Haringey the rate of increase in SFRI is significantly higher than elsewhere. In these areas, the SFRI in the future is much greater than today.


Cities in decline and their influence on flood disadvantage


City regions in relative economic decline tend to experience levels of flood disadvantage above the UK average; suggesting flood risk could undermine economic growth in areas that need it most. Sixteen of the 24 cities classed as in relative decline  experience levels of flood disadvantage above the UK average. This reflects a combination of influences but is driven by higher than average levels of vulnerability (as shown by the NFVI) and a greater than average number of people exposed to frequent flooding (in Glasgow, for example, those living in the floodplain are almost twice as likely to experience frequent flooding than the UK average). When income and insurance penetration are considered, the relative economic pain associated with flooding is significantly higher in these sixteen cities, reflecting the lower levels of income (on average) and lower levels of insurance. Belfast, Grimsby, Glasgow and Hull are all examples of struggling city-regions where the flood disadvantage is much higher than the UK average.


Recent developments in vulnerable neighbourhoods (England)


Recent developments (2008-14) in areas prone to frequent coastal and surface water flooding (1-in-75 years or more frequent) have disproportionally taken place in the most vulnerable neighbourhoods. Analysis by the Adaptation Sub-Committee (ASC) of new developments built between 2008 and 2014 found that floodplain development continues19. Further review of this analysis highlights that of the 1,199,000 new residential developments built in the period 2008-14, 225,000 (or 20%) were built in flood prone areas (across all sources) with one in four of those properties being built in the 20% most vulnerable neighbourhoods. Vulnerable neighbourhoods in coastal and surface water floodplains have experienced greatest disproportionality in development.  For coastal floodplains and surface water prone areas, new properties are ~20% more likely to be in areas prone to more frequent flooding (1:75 or greater) for the 20% most vulnerable neighbourhoods than for all neighbourhoods.

By the 2080s all developments built between 2008 and 2014 will experience a significant increase in exposure to flooding.  Across all sources of flooding the increase is greatest in those developments built in the most vulnerable neighbourhoods; a discrepancy that is most significant at the coast.


Long-term investment in England: Evidence for greater investment in vulnerable neighbourhoods


There is strong evidence to support improving the protection provided to the most vulnerable neighbourhoods. Reanalysis of the optimised investment scenario in England within the Long‐Term Investment Scenarios (LTIS) (used to support the case for investment in flood risk management20) highlights a long-term economic case for improving the protection afforded to vulnerable communities, suggesting there is both an economic and a social justice argument for improving protection. It is also clear that income (and consequently health) are important drivers of flood vulnerability and are directly influenced by broader welfare, social and economic policy. To enhance FRM outcomes, opportunities from broader policy areas will be required to address localised flood disadvantage. This will include recognising the linkage between green infrastructure responses, such as Sustainable Urban Drainage Systems (SUDS), and the wider health and wellbeing benefits they provide. It will also be increasingly important to recognise the role of planning/welfare or other social policy interventions play in either increasing or offsetting flood disadvantage (by putting more people into areas exposed to risk in the case of planning or increasing vulnerability through cuts to welfare benefits affecting incomes).


High temperatures


The combination of present-day vulnerability and future patterns of temperatures shows that extreme heat disadvantage is mainly associated with densely populated urban locations (London, Birmingham); to a lesser degree it affects the East of England, South East and South West. In the north of England, the projected increase in future temperatures is less extreme than in the south, resulting in less pronounced disadvantage to heat. Maps of the distributions of heat disadvantage, exposure to high temperatures and heat-related socio-spatial vulnerability are given in Figure 9. Look in more detail at the maps for your area in the map tool.

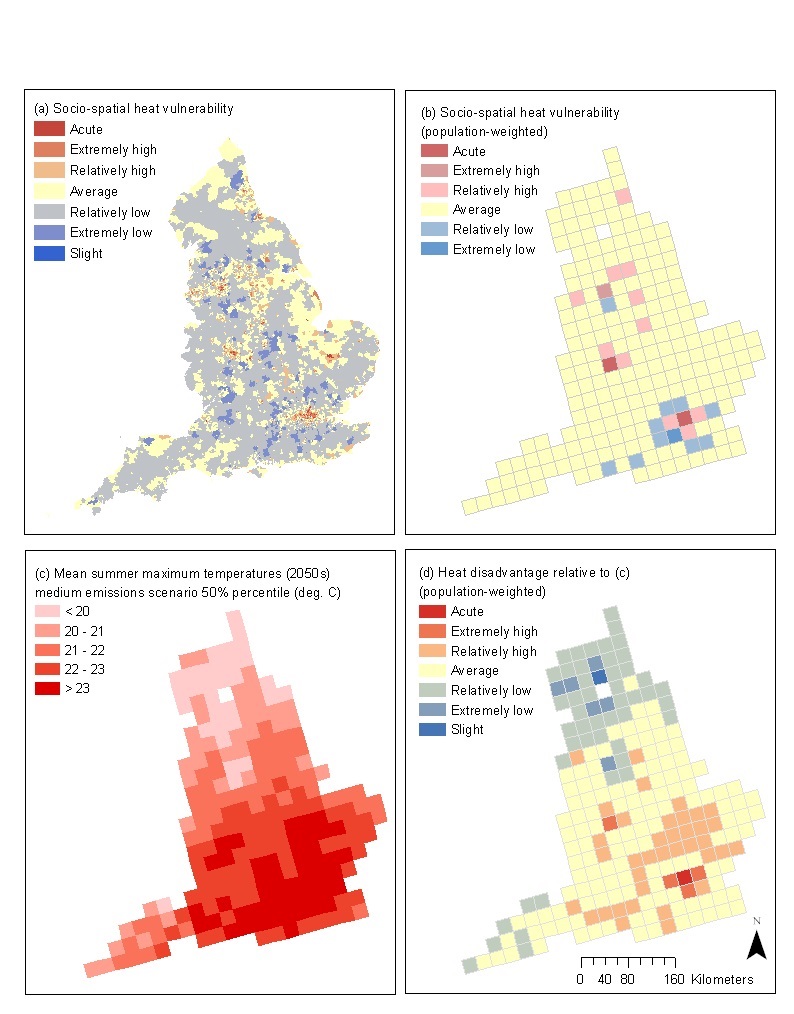
Figure 9: (a) Socio-spatial heat vulnerability in England: by neighbourhood (b), expressed as a population-weighted total (c), heat hazard-exposure  measured as the medium emissions scenario 50% percentile mean summer maximum temperatures in the 2050s (d) and heat disadvantage relative to (c).


Around 9% of English neighbourhoods are extremely socially vulnerable with respect to heat which is similar to the proportion estimated for 2001. Due to changes in some of the indicators used in the index it is not possible to directly compare 2001 and 2011 with confidence.  


London is the region with the highest proportion of its neighbourhoods estimated to be extremely socially vulnerable to heat, followed by the West Midlands and the North West (with high concentrations around Manchester and Birmingham). London neighbourhoods have the highest average (mean) socio-spatial heat vulnerability scores in England. Relative to the rest of England, almost 25% of all London neighbourhoods were highly socially vulnerable with respect to heat in 200115. This proportion has grown to 28% in 201116 (Figure 10). It represents getting on for half of all of England’s neighbourhoods estimated to be socially vulnerable with respect to heat (47%). Regions with the most neighbourhoods in the lowest socio-spatial heat vulnerability class are in the South East and East of England. However, this lower vulnerability is offset to some extent by the chance of seeing higher temperatures, relative to northern England, for example.


Figure 10: Proportions (%) of the total number of a region’s neighbourhoods estimated to have extremely high or extremely low social vulnerability with respect to heat.


It is well known that urban areas can exacerbate the impacts of events like heat-waves and flooding through the Urban Heat IsIand effect. The disproportionate effect of climate and weather events on urban residents is shown by higher heat mortality rates than in rural settings. However, it is important to recognise that some neighbourhoods are more prone to extreme effects than others and differences relate to individual, environment and social factors. There are uneven patterns of access to green spaces within cities so that some communities – for example with a large proportion of black and ethnic minorities or which are classified as deprived - are disproportionately associated with dense urban areas with little green space. There is also a connection between some vulnerable groups and certain types of housing and for that housing to be located in places where there is a higher chance of being affected, e.g. in older, terraced accommodation in valley bottoms. Analyses carried out for London have revealed that relatively high proportions of key social infrastructure associated with health and education – and therefore with key vulnerable groups - is located within areas which are susceptible to flooding.


Back to the top


References

  1. Greater London Authority (2006) London's Urban Heat Island
  2. Hajat, S., Kovats, R.S., Lachowycz, K. (2007) “Heat-related and cold-related deaths in England and Wales: who is at risk?”, Occupational & Environmental Medicine, 64, pp. 93-100.
  3. CABE (2010) “Urban Green Nation: Building the evidence base”, Commission for Architecture and the Built Environment, London.
  4. Houston, D., Werritty, A., Bassett, D., Geddes, A., Hoolachan, A. & McMillan, M. (2011) “Pluvial (rain-related) flooding in urban areas : the invisible hazard”, Joseph Rowntree Foundation, York
  5. GLA (2009) “London Regional Flood Risk Appraisal”, Greater London Authority.
  6. Zsamboky, M., Fernandez-Bilbao, A., Smith, D., Knight, J. & Allan, J. (2011) “Impacts of climate change on disadvantaged UK coastal communities”, Joseph Rowntree Foundation, York.
  7. Preston et al (2014).
  8. Office for National Statistics (2013) A Profile of Deprivation in Larger English Seaside Destinations, 2007 and 2010
  9. Walker, G., Burningham, K., Fielding, J., Smith, G., Thrush, D. & Fay, H. (2006) Using science to create a better place: Addressing Environmental Inequalities: Flood Risk, Science Report: SC020061/SR1, Environment Agency, Bristol.
  10. Oven, K.J. et al. (2012) Climate change and health and social care: Defining future hazard, vulnerability and risk for infrastructure systems supporting older people’s health care in England, Applied Geography, 33(1): 16–24.
  11. Zsamboky, M., Fernandez-Bilbao, A., Smith, D., Knight, J. & Allan, J. (2011) “Impacts of climate change on disadvantaged UK coastal communities”, Joseph Rowntree Foundation, York.
  12. Zsamboky, M., Fernandez-Bilbao, A., Smith, D., Knight, J. & Allan, J. (2011) “Impacts of climate change on disadvantaged UK coastal communities”, Joseph Rowntree Foundation, York.
  13. Curtis, K.J. & Schneider, A. (2011) “Understanding the demographic implications of climate change: estimates of localized population predictions under future scenarios of sea-level rise”, Population and Environment, 33(1), pp. 28–54.
  14. Curtis, K.J. & Schneider, A. (2011) “Understanding the demographic implications of climate change: estimates of localized population predictions under future scenarios of sea-level rise”, Population and Environment, 33(1), pp. 28–54.
  15. Lindley, S., O’Neill, J., Kandeh, J., Lawson, N., Christian, R. & O’Neill M. (2011) “Climate change, justice and vulnerability”, Joseph Rowntree Foundation Report, York.
  16. Lindley, S., O’Neill, J., Kandeh, J., Lawson, N., Christian, R. & O’Neill M. (2011) “Climate change, justice and vulnerability”, Joseph Rowntree Foundation Report, York.
  17. Sayers, P.B., Horritt, M., Penning Rowsell, E., and Fieth, J. (2017). Present and future flood vulnerability, risk and disadvantage: A UK scale assessment. A report for the Joseph Rowntree Foundation published by Sayers and Partners LLP. 
  18. Pike, A., MacKinnon, D., Coombes, M., Champion, T., Bradley, D., Cumbers, A., Robson, L. and Wymer, C. (2016). Uneven growth: tackling city decline. A report published by the Joseph Rowntree Foundation, York.

  19. ASC (2015). Progress in preparing for climate change 2015. Report to Parliament Committee on Climate Change June 2015. Report by the Adaptation Sub‐Committee. 

  20. Environment Agency (2014). Flood and coastal erosion risk management Long‐term investment scenarios (LTIS) 2014


Consider the general actions which you can take:


Identify locations in your local area which have extremely high social vulnerability and extremely high disadvantage to different hazards using the Climate Just Map tool. These places are a good place to start when considering developing responses as they indicate a local area which has challenges in terms of the potential for being affected by an event like a flood or heat wave and also the likelihood for the social impacts of those events to be greater.


Identify locations in your local area which have different profiles of socio-spatial vulnerability and disadvantage using the Climate Just Map tool. A local area may not be highlighted as having extremely high socio-spatial vulnerability. However, this does not necessarily mean that no action is required. For example, the area may still be associated with extremely high values in individual indicators or elements of social vulnerability, such as inability to prepare, recover or respond. Finer scale flood data have reduced some of the problems with the original data, but even in areas with very low overall social vulnerability, there is still a high likelihood that there will be some vulnerable people who require assistance in order to avoid being severely impacted. Different actions will be appropriate for each of these different neighbourhood types (see Figure 10).  

Figure 10: Actions related to different climate disadvantage types.


Develop multi-dimensional assessments of social vulnerability and consider how people and communities can face multiple challenges which may be important for building resilience. Multi-dimensional assessments take account of different causes of uneven impacts, different geographical scales, different time-frames and different perspectives of the issues. Adaptation can be made more effective by taking account of differences in the sensitivity or susceptibility to harm of people and communities, differences in abilities to prepare for, respond to and recover from extreme weather events, and differences in the physical characteristics of neighbourhoods themselves. Each of these dimensions or characteristics and the individual indicators behind them can be explored using the resources in the Map tool. Part of this activity involves considering finer scale geographical data and data for more recent datasets which is held within your organisation or partner organisations. See the examples of how to interpret the data for local areas.1  


Benefits can be gained from mainstreaming climate adaptation measures and messages into the activities of agencies working with vulnerable groups such as social care providers. See suggested broader actions you can take to improve resilience such as those associated with partnership working, raising awareness and community engagement and empowerment. Examples of actions that address social vulnerabilities at the local authority level could include the following:

  • addressing institutional routines and habits of places such as in residential nursing homes and other places which provide care.  See for example Advice for care home managers and staff: supporting vulnerable people before and during a heatwave
  • maintaining and improving social care for the elderly in their homes, using for example telecare solutions such as Bournemouth Borough Council's Careline services.
  • the use of public spaces such as post offices and libraries in which members of the local community can meet and which might act as safe spaces during floods or cool spots during heatwaves, and making other spaces, such as schools and local businesses, available to the public in the event of a climate hazard. See an analysis of provision of social infrastructure in relation to vulnerable groups in Greater Manchester;2
  • fostering community support groups and engaging and empowering local communities in decision making about responses to flooding. See the sections on community engagement and awareness raising and partnership working.


Identify the magnitude and likelihood of hazards associated with the changing climate, including flooding and heatwaves.

  • Use the measures of flooding and high temperatures in the Climate Just Map tool to compare patterns of socio-spatial vulnerability with patterns of potential exposure to flooding and heatwaves.
  • Make reference to the updated maps of flood disadvantage in the Climate Just Map tool which take account of climate change.
  • Draw on existing risk assessments, adaptation tools such as the UKCP09 projections and the UKCP18 (which will update UKCP09 over UK land areas and sea-level rise, giving greater regional detail) as well as  other local information (for example following the UKCIP Local Climate Impacts Profile (LCLIP) process).  See an example LCLIP for Greater Manchester.
  • Examine the impacts of extreme weather events including their location, timing, costs and the effectiveness of responses by recording local experiences. Record social as well as economic impacts associated with events and consider longer-term and not just immediate impacts.


Review the case studies section to see what others have done. In particular see the Further Resources (Section 6, above) for information about work carried out by:

  • JBA consultants on using the Climate Just data to support adaptation planning in Wigan Council. Their work makes suggestions about how you might use the data for supporting the development of adaptation plans and other responses.
  • Hampshire County Council which has developed its own version of the data in this portal. This is supported by a ‘how to’ document which explains some of the technical details which may be suitable for data specialists within your authority.
  • Leeds City Council which has developed an online mapping portal covering multiple indicators of social vulnerability.


Consider specific actions to help build resilience for the people and communities that you identify.

  • See Who is vulnerable? to find out more about actions associated with particular socially vulnerable groups, recognising it is the combination of characteristics which can determine the most extreme social vulnerability.


Back to the top


  1. Use the map tool to build up a profile of the neighbourhoods in your area. Consider vulnerability and potential exposure, the nature of vulnerability and different indicators. Look, in particular, for values which are high or extremely high.
  • Use the case studies and worked examples in the Further Resources section (Section 6, above) to see how others have made use of the data. Also see our detailed User Guide for flood-related data and the User Guide for heat-related data.
  • See Figure 12 (in Section 4, above) for more information about neighbourhood types.


  1. Determine what broad types of neighbourhoods exist in your area as a result of your profiling work.
  • Do you have any extremely vulnerable or climate disadvantaged areas which could be targeted for further action? After further investigation you may be able to construct a case for additional external support to help you to develop responses for some of these areas.
  • Do you have any areas which although not extremely vulnerable overall, have particular issues in terms of very high levels of sensitivity or susceptibility, or some of the different social factors? Specific indicators can help you highlight particular groups with specific needs and help you to involve the right partners in developing and delivering appropriate responses.
  • Do you have areas which are mainly average or low vulnerability where you could raise general awareness to help communities to help themselves, or where communities might be encouraged to support more vulnerable individuals?
  • Do you have areas which are less socially vulnerable but have the potential for high exposure and which should be targeted in terms of raising awareness and promoting self-help, or where physical rather than social solutions might be important?
  • Does the profile of your area of interest suggest that other actions might help to reduce impacts, such as establishing more green infrastructure or promoting building level adaptations? 


  1. Verify the data for your area through a combination of local knowledge and additional internal data resources. For example you may want to:
  • Involve data departments in your authority or at County level to determine whether there are data at different geographical scales (particularly in rural areas where neighbourhoods cover large geographical areas) or which have been made available after 2011. You might consider the following questions: How can these data be used within the broader framework for understanding social vulnerability and climate disadvantage? What do internal resources suggest about very local areas within neighbourhoods which are not identified in the national data? What trends are apparent in your area? How can the data be used to supplement, develop or replace some of the provided indicators? What are priorities for action for developing the data?
  • This activity may also involve selected representatives within your organisation or partners in service delivery with particular specialisms, for example in health, transport, planning, environment, housing or social care.


  1. Use the data to discuss broad themes and ideas related to vulnerabilities and associated actions and to draw up a set of priorities.
  • Discuss the data and local profiles at a meeting with your partners in service delivery and, where appropriate, neighbouring authorities. For example, your use of the data can complement existing internal and external decision-making processes designed to help with flood and coastal risk management (Figure 10).  Your activities should also fit within other decision-making processes for local adaptation, e.g. the UKCIP Adaptation Wizard.
  • Partner with representatives of the voluntary and community sector and consider how and when to involve local communities in discussions. When using data externally, consider how this can be done without causing unnecessary concern or possibly stigmatising areas, for example through avoiding explicit reference to place names or street names.


  1. Consider what additional data need to be collected to support your activities. Is it feasible to collect additional data locally or is action required at county and/or national scales?  Additional data resources may be available from other tools and resources. See the Further Resources (Section 6, above) for a list of tools that you could use to develop further information on some of the themes in the Climate Just data, and avoid starting from scratch. However, even where data are imperfect, they can still be used to frame discussion.


  1. Review the Recommended general actions. This includes information about raising awareness and partnership working.


  1. Review the specific actions associated with particular vulnerable groups. Also consider how multiple priorities can be delivered together for some of these groups, e.g. relating to a range of hazards or relating to a range of ways which individuals and communities might be affected.


  1. Use the data and information to inform local adaptation plans or other related actions. Updated and refined data from our map tool may also help to support decision-making for required investment in flood defences or considering the impact of planned development. 

Figure 13: Flood and Coastal Risk Management process for Government activities.1


On this page:


Please note that although the In depth: which places are disadvantaged message has been updated, the resources in this section are from 2015. A selected number of new resources are listed in the existing tools and guidance area of this site.

Tools and resources

Name

Developer

Type of Resource

Climate Just map data User Guide This document provides technical information about the indicators and index shown on the map data. It needs to be used alongside any downloaded data.

University of Manchester

Technical Guidance

Climate Just worked example Use this resource to understand how a profile of a local area can be developed from the provided data for your area

University of Manchester

Guidance

A grid based approach to estimating social vulnerability and potential exposure to flood and heat-waves. A technical document explaining the way that Hampshire County Council mapped social vulnerability

Hampshire County Council

‘How to’ document

Local Climate Impacts Profile (LCLIP)

Designed to support the UKCIP Climate Adaptation Wizard, this tool supports the assessment of past weather-related events and their impacts as a basis for understanding the possible impacts of future weather-related events.

UKCIP

Guidance and Spreadsheets

Community Resilience Toolkit

Aimed at local communities and the organisations working with them, this set of resources supports the process of understanding local needs and developing emergency plans based on those needs

Cabinet Office (UK)

Communities

Reports, checklists and case studies

Severe Weather Impacts Monitoring System (SWIMS)

A data collection tool to encourage learning around the impacts of and responses to past extreme weather events as the basis for improved future decision-making.

Kent County Council

Online Tool

Built Infrastructure for Older People’s Care in Conditions of Climate Change (BIOPICCC) Toolkit

Aimed at anyone with a role in supporting health and social care for older people. Resources cover understanding needs and protecting infrastructure.

Durham University

Health and Social Care

Online Tool

Advice produced through the Heat-wave plan for England 2013

The heat-wave plan contains advice for a range of practitioners and the public

Supporting vulnerable people before and during a heatwave – Advice for health and social care professionals

Looking after yourself and others during hot weather – The latest advice

Public Health England

Advice for different groups

Public Health Outcomes Data Tool

A set of indicators and associated data about public health and health inequalities supporting the Public Health Outcomes Framework. Data Indicators are updated on a regular basis and available at a range of geographies across England

Public Health England

Health sector

Data

Strategic Health Asset Planning and Evaluation (SHAPE)

A mapping tool principally aiming to support strategic planning of health services and infrastructure but which has a role in providing more effective adaptation solutions.

NHS

Health Sector

Online Tool

Advice for care home managers and staff: supporting vulnerable people before and during a heat-wave


Public Health England

Health sector

Guidance document

Advice for health and social care practitioners: supporting vulnerable people before and during a heat-wave

Public Health England

Health sector

Guidance document

Six Steps to Flood Resilience

Designed to address the lack of easy-to-use guidance to support the use of novel flood resilience measures in planning, this resource provides a process to follow and resources for further information

Building Research Establishment, Manchester Metropolitan University and University of Manchester

Guidance document

Climate Adaptation Wizard

This long-standing tool provides the basis for supported decision-making in relation to climate change risk assessment and climate adaptation planning.

UKCIP/Environment Agency

Documents and online materials; connected tools


Reports


Name

Author

Type of Resource

Case studies of adaptation to climate change in south-west England.

Benzie et al (2011)

Report

Impacts of climate change on disadvantaged UK coastal communities

Zsamboky et al (2011)

Report

Pluvial (rain-related) flooding in urban areas: the invisible hazard.

Houston et al (2011)

Report

Climate change, justice and vulnerability

Lindley et al (2011)

Report

UK Climate Change Risk Assessment: Evidence Report, London

Defra

Report

Sustainable, Resilient, Healthy People & Places A Sustainable Development Strategy for the NHS, Public Health and Social Care system

Public Health England and the NHS Sustainable Development Unit (2014)

Report

Adaptation to Climate Change for Health and Social care organisations “ Co-ordinated, Resilient, Prepared”.

NHS Sustainable development Unit (2012)

Report

Telecare: a crucial opportunity to help save our health and social care system

Yeandle (2009)

Report


Case studies and examples


Name

Developer

Type of Resource

A county perspective on social vulnerability assessment and its uses: the case of Hampshire This case study outlines how Hampshire County Council initiated and implemented an assessment of social vulnerability.

Hampshire County Council

Case study

Creating a core cities mapping tool for responding to climate change related extreme weather This case study documents the creation of a GIS mapping tool that would allow partners within and outside of Leeds City Council to prepare for and respond to climate change related extreme weather and which could be transferred to the remaining core cities and other areas

Leeds City Council

Case Study

Using Climate Just data in Wigan Outline of how JBA consultants worked with Wigan Council to use the ClimateJust data to develop local adaptation measures

JBA consultants & Wigan Council

Guidance & Case Study

Greater Manchester Local Climate Impacts Profile

Ecocities

Online example of an LCLIP

Example of a Joint Strategic Needs Assessment

London Borough of Hackney

Online material (external)


Back to the top


References

Benzie, M, Harvey, A, Burningham, K, Hodgson, N and Siddiqi, A (2011) Vulnerability to heatwaves and drought: adaptation to climate change, JRF

CABE (2010) “Urban Green Nation: Building the evidence base”, Commission for Architecture and the Built Environment, London.

Cutter, S. L., Emrich, C. T., Webb, J. J. and Morath, D. (2009) Social Vulnerability to Climate Variability Hazards: A Review of the Literature. Hazards and Vulnerability Research Institute, University of South Carolina, Columbia. [Accessed 20 November 2009]

Curtis, K.J. & Schneider, A. (2011) “Understanding the demographic implications of climate change: estimates of localized population predictions under future scenarios of sea-level rise”, Population and Environment, 33(1), pp. 28–54.

DCLG (2011) The English Indices of Deprivation 2010 Neighbourhoods Statistical Release Last accessed May 2014.

Defra (2009) Appraisal of flood and coastal erosion risk management: A Defra policy statement

Defra and the Environment Agency (2011) Understanding the risks, empowering communities, building resilience The national flood and coastal erosion risk management strategy for England

Defra (2011a) Guidance for risk management authorities on sustainable development in relation to their flood and coastal erosion risk management functions

Defra (2011b) DEFRA (2011b) Mainstreaming sustainable development – The Government’s vision and what this means in practice

Greater London Authority (2006) London's Urban Heat Island summary report

Hajat, S., Kovats, R.S., Lachowycz, K. (2007) “Heat-related and cold-related deaths in England and Wales: who is at risk?”, Occupational & Environmental Medicine, 64, pp. 93-100.

Houston, D., Werritty, A., Bassett, D., Geddes, A., Hoolachan, A. & McMillan, M. (2011) “Pluvial (rain-related) flooding in urban areas : the invisible hazard”, Joseph Rowntree Foundation, York

IPCC (2007) Climate Change 2007: Impacts, Adaptation, and Vulnerability. Contribution of Working Group II to the Fourth Assessment Report of the Intergovernmental Panel on Climate Change, Parry, M. L., Canziani, O. F., Palutikof, J. P., van der Linden, P. J. and Hanson, C. E. (eds). Cambridge: Cambridge University Press

Knight, J. & Allan, J. (2011) “Impacts of climate change on disadvantaged UK coastal communities”, Joseph Rowntree Foundation, York.

Lindley, S. J., O’Neill, J., Kandeh, J., Lawson, N., Christian, R. & O’Neill M. (2011) “Climate change, justice and vulnerability”, Joseph Rowntree Foundation Report, York

Lindley, S. J and O’Neill, J. (2013) Flood disadvantage in Scotland: mapping the potential losses in well-being. Scottish Government Social Research

McGregor, G. R., Pelling, M., Wolf, T. and Gosling, S. (2007) The Social Impacts of Heatwaves, Science Report – SC20061/SR6. Environment Agency.

Oven, K.J. et al. (2012) Climate change and health and social care: Defining future hazard, vulnerability and risk for infrastructure systems supporting older people’s health care in England, Applied Geography, 33(1): 16–24

Preston, I., Banks, N., Hargreaves, K. Kazmierczak, A., Lucas, K., Mayne, R., Downing, C and Street, R  (2014) Climate Change and Social Justice: an evidence review

SNIFFER (2009) Differential social impacts of climate change in the UK. SNIFFER Project UKCC22.

Tapsell, S. M., Tunstall, S. M., Green, C. and Fernandez, A. (2005) Indicator set. Report T11-07-01 of FLOODsite Integrated Project, Flood Hazard Research Centre, Enfield. Tapsall, et al., 2005

Walker, G., Burningham, K., Fielding, J., Smith, G., Thrush, D. & Fay, H. (2006) “Using science to create a better place: Addressing Environmental Inequalities: Flood Risk”, Science Report: SC020061/SR1, Environment Agency, Bristol

GOV.UK Discrimination: your rights (webpage) and Definition of disability under the Equality Act 2010

Public Health England (2013) Heatwave Plan for England

Office for National Statistics (2013) A Profile of Deprivation in Larger English Seaside Destinations, 2007 and 2010